JVC 2013 Annual Report Download - page 5
Download and view the complete annual report
Please find page 5 of the 2013 JVC annual report below. You can navigate through the pages in the report by either clicking on the pages listed below, or by using the keyword search tool below to find specific information within the annual report.-
 1
1 -
 2
2 -
 3
3 -
 4
4 -
 5
5 -
 6
6 -
 7
7 -
 8
8 -
 9
9 -
 10
10 -
 11
11 -
 12
12 -
 13
13 -
 14
14 -
 15
15 -
 16
16 -
17
-
18
-
19
-
20
-
21
-
22
-
23
-
24
-
25
-
26
-
27
-
28
-
29
-
30
-
31
-
32
-
33
-
34
-
35
-
36
-
37
-
38
-
39
-
40
-
41
-
42
-
43
-
44
 |
 |
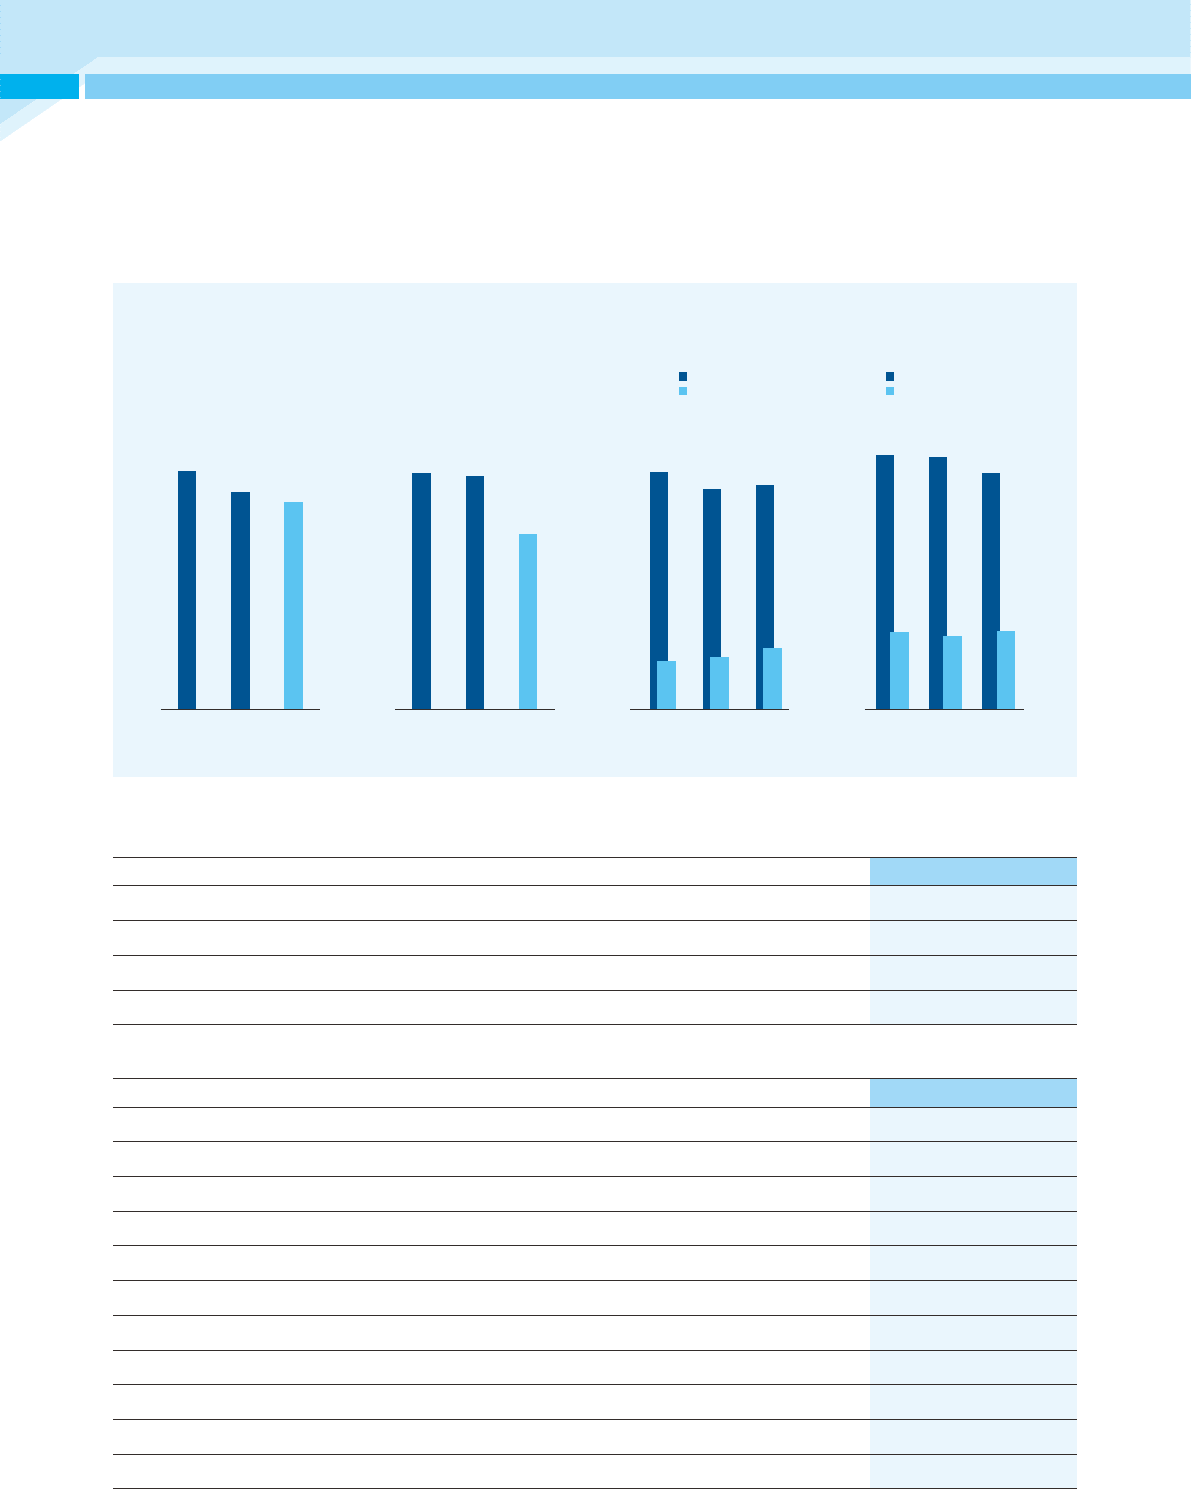
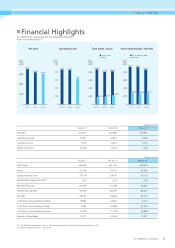
(Millions of Yen)
FYE 3/ʼ11 FYE 3/ʼ12 FYE 3/ʼ13
Net sales 352,672 320,869 306,581
Operating income 12,957 12,813 9,604
Ordinary income 7,579 6,420 3,106
Net income (loss) (4,025) 6,032 1,146
(Millions of Yen)
FYE 3/ʼ11 FYE 3/ʼ12 FYE 3/ʼ13
Total assets 260,664 241,762 246,614
Equity 52,740 57,073 67,240
Equity per share (Yen) 375.19※1399.76 473.18
Stockholders' equity ratio (%)※220.0 22.9 26.6
Retained earnings (41,305) 24,188 24,687
Interest-bearing debt 93,053 92,369 86,467
Net debt 28,081 26,808 28,706
Cash flows from operating activities 19,987 8,883 9,772
Cash flows from investing activities 5,354 (6,498) (13,357)
Cash flows from financing activities (2,291) (1,523) (8,609)
Number of employees 17,271 13,594 12,781
Millions
of yen
400,000
300,000
200,000
100,000
FYE 3/’11 FYE 3/’12
00
12,000
15,000
Millions
of yen
9,000
6,000
3,000
FYE 3/’13FYE 3/’11 FYE 3/’12
300,000
Millions
of yen
240,000
180,000
120,000
60,000
FYE 3/’11 FYE 3/’12
0
100,000
Millions
of yen
80,000
60,000
40,000
20,000
FYE 3/’11 FYE 3/’12
0
Net sales Operating income Total assets / Equity Interest-bearing debt / Net debt
Total assets
Equity
Interest-bearing debt
Net debt
12,813
9,604
12,957 260,664
52,740
FYE 3/’13
241,762
57,073
246,614
67,240
93,053
28,081
FYE 3/’13
92,369
26,808
86,467
28,706
352,672
FYE 3/’13
320,869 306,581
※1. JVCKENWOOD conducted a 10-for-1 stock consolidation of its common shares effective August 1, 2010.
※2. (Equity – Minority interests) ÷ Total assets
3
JVC KENWOOD Corporation
Financial Highlights
JVC KENWOOD Corporation and Consolidated Subsidiaries
Fiscal Year ended March 31
Financial Highlights