JVC 2013 Annual Report Download - page 4
Download and view the complete annual report
Please find page 4 of the 2013 JVC annual report below. You can navigate through the pages in the report by either clicking on the pages listed below, or by using the keyword search tool below to find specific information within the annual report.-
 1
1 -
 2
2 -
 3
3 -
 4
4 -
 5
5 -
 6
6 -
 7
7 -
 8
8 -
 9
9 -
 10
10 -
 11
11 -
 12
12 -
 13
13 -
 14
14 -
 15
15 -
16
-
17
-
18
-
19
-
20
-
21
-
22
-
23
-
24
-
25
-
26
-
27
-
28
-
29
-
30
-
31
-
32
-
33
-
34
-
35
-
36
-
37
-
38
-
39
-
40
-
41
-
42
-
43
-
44
 |
 |
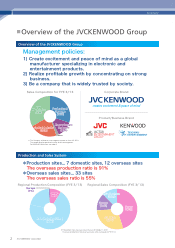
Management policies:
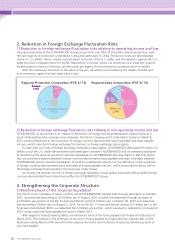
Sales Composition for FYE 3/’13
Car
Electronics
(33%)
Professional
Systems
(30%)
Entertainment
Software
(13%)
Optical & Audio
(22%)
Others
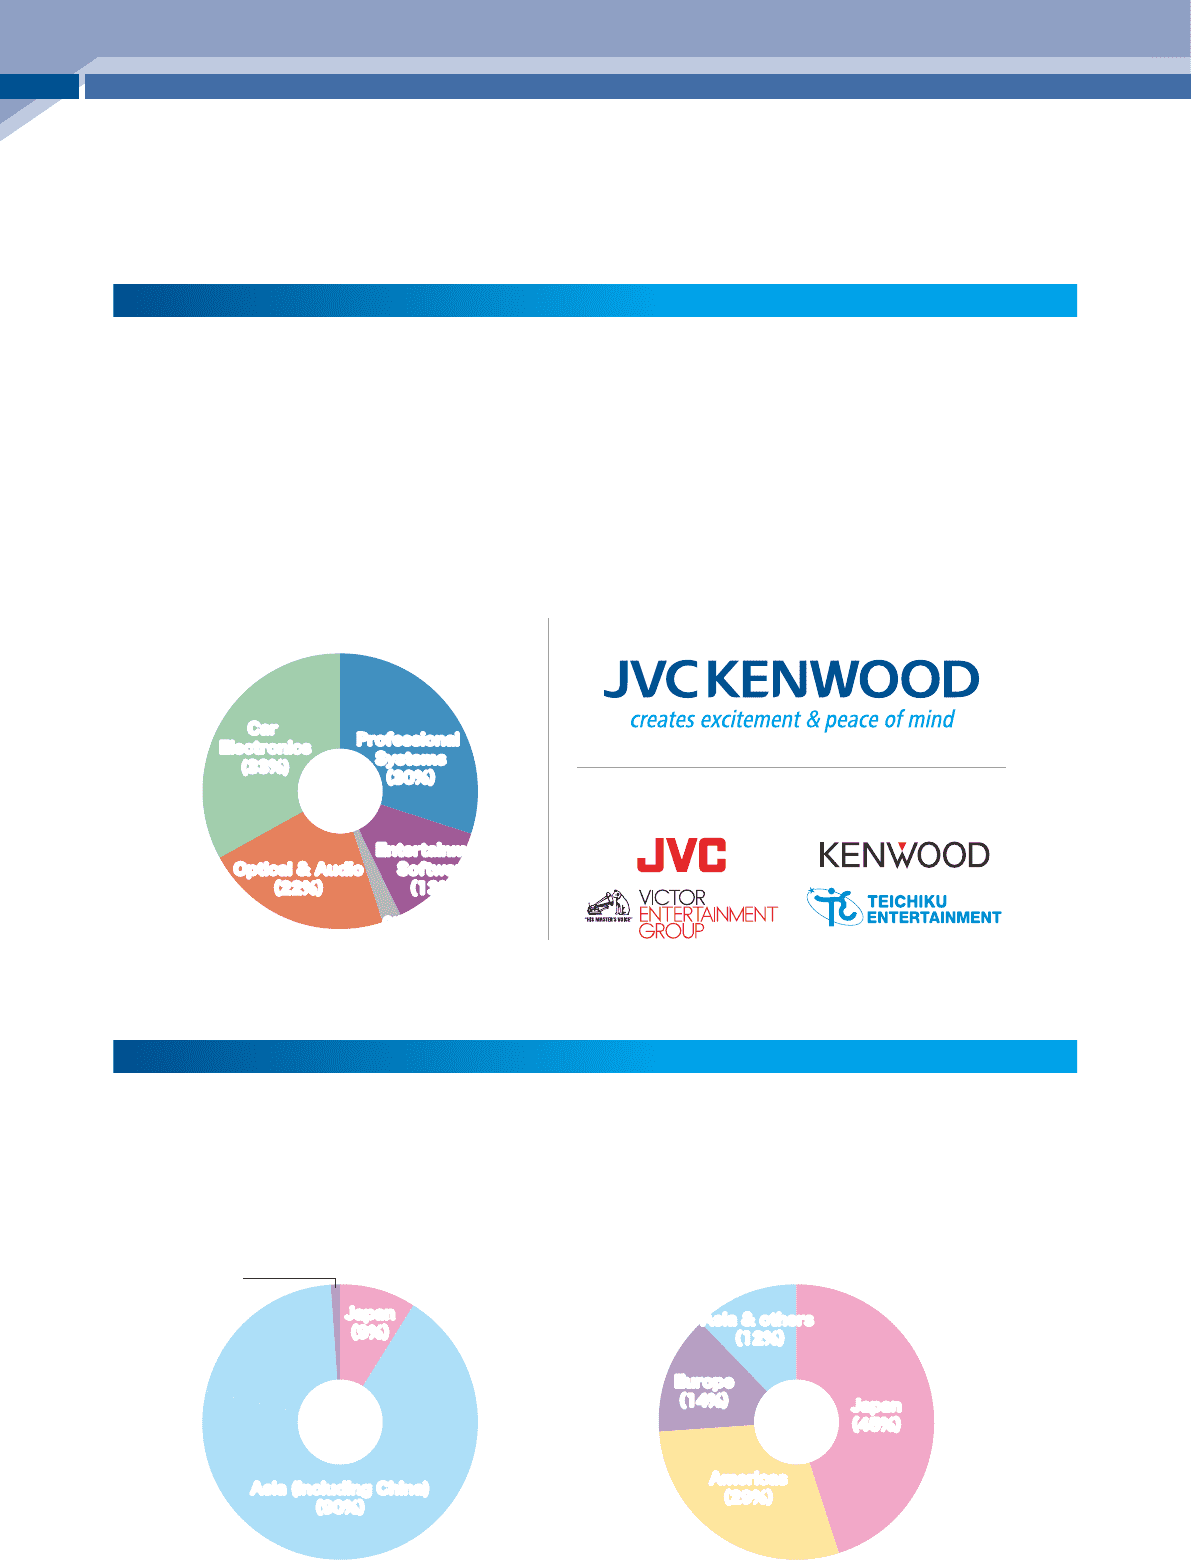
Regional Sales Composition (FYE 3/’13)
Europe
(14%) Japan
(45%)
Americas
(29%)
Asia & others
(12%)
Product/Business Brand
Corporate Brand
*Production sites... 7 domestic sites, 12 overseas sites
The overseas production ratio is 91%
*Overseas sales sites... 33 sites
The overseas sales ratio is 55%
Regional Production Composition (FYE 3/’13)
Europe
(1%)
Europe
(1%) Japan
(9%)
Japan
(9%)
Asia (including China)
(90%)
Asia (including China)
(90%)
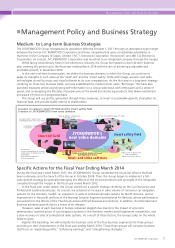
* The Company shifted to a new segment system on June 25, 2013.
The graphs provide details of results for the old segments.
For detailed information, see page 8.
* Production sites, overseas sales sites as of October 1, 2013
Overseas production ratio, overseas sales ratio are based on FYE 3'13.
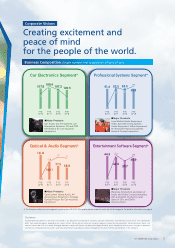
1) Create excitement and peace of mind as a global
manufacturer specializing in electronic and
entertainment products.
2) Realize profitable growth by concentrating on strong
business.
3) Be a company that is widely trusted by society.
Overview of the JVCKENWOOD Group
Production and Sales System
2JVC KENWOOD Corporation
Overview of the JVCKENWOOD Group
Summary