JP Morgan Chase 2008 Annual Report Download - page 8
Download and view the complete annual report
Please find page 8 of the 2008 JP Morgan Chase annual report below. You can navigate through the pages in the report by either clicking on the pages listed below, or by using the keyword search tool below to find specific information within the annual report.-
 1
1 -
 2
2 -
 3
3 -
 4
4 -
 5
5 -
 6
6 -
 7
7 -
 8
8 -
 9
9 -
 10
10 -
 11
11 -
 12
12 -
 13
13 -
 14
14 -
 15
15 -
 16
16 -
 17
17 -
 18
18 -
 19
19 -
20
-
21
-
22
-
23
-
24
-
25
-
26
-
27
-
28
-
29
-
30
-
31
-
32
-
33
-
34
-
35
-
36
-
37
-
38
-
39
-
40
-
41
-
42
-
43
-
44
-
45
-
46
-
47
-
48
-
49
-
50
-
51
-
52
-
53
-
54
-
55
-
56
-
57
-
58
-
59
-
60
-
61
-
62
-
63
-
64
-
65
-
66
-
67
-
68
-
69
-
70
-
71
-
72
-
73
-
74
-
75
-
76
-
77
-
78
-
79
-
80
-
81
-
82
-
83
-
84
-
85
-
86
-
87
-
88
-
89
-
90
-
91
-
92
-
93
-
94
-
95
-
96
-
97
-
98
-
99
-
100
-
101
-
102
-
103
-
104
-
105
-
106
-
107
-
108
-
109
-
110
-
111
-
112
-
113
-
114
-
115
-
116
-
117
-
118
-
119
-
120
-
121
-
122
-
123
-
124
-
125
-
126
-
127
-
128
-
129
-
130
-
131
-
132
-
133
-
134
-
135
-
136
-
137
-
138
-
139
-
140
-
141
-
142
-
143
-
144
-
145
-
146
-
147
-
148
-
149
-
150
-
151
-
152
-
153
-
154
-
155
-
156
-
157
-
158
-
159
-
160
-
161
-
162
-
163
-
164
-
165
-
166
-
167
-
168
-
169
-
170
-
171
-
172
-
173
-
174
-
175
-
176
-
177
-
178
-
179
-
180
-
181
-
182
-
183
-
184
-
185
-
186
-
187
-
188
-
189
-
190
-
191
-
192
-
193
-
194
-
195
-
196
-
197
-
198
-
199
-
200
-
201
-
202
-
203
-
204
-
205
-
206
-
207
-
208
-
209
-
210
-
211
-
212
-
213
-
214
-
215
-
216
-
217
-
218
-
219
-
220
-
221
-
222
-
223
-
224
-
225
-
226
-
227
-
228
-
229
-
230
-
231
-
232
-
233
-
234
-
235
-
236
-
237
-
238
-
239
-
240
 |
 |

6
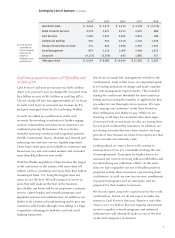
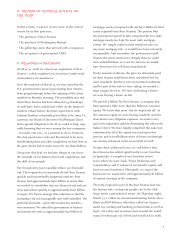
Commercial Banking reported net income of $1.4 billion
with an ROE of 20%
Commercial Banking delivered strong results, outper-
forming its peer group and even exceeding our 2008
plan in a tough year. Strong credit quality, risk
management, client service, operational efficiency,
expense control and effective pricing all contributed to
the strong result: a 27% increase to a record $1.4 bil-
lion of net income, on a record $4.8 billion in revenue.
And instead of relying on lending to be the key driver
of revenue, Commercial Banking achieved record
results in gross investment banking revenue of $966
million (up 9%), treasury services revenue of $2.6
billion (up 13%), average liability balances of $103.1
billion (up 18%) and average loan balances of $82.3
billion (up 35%). It also is notable that only 36% of
Commercial Banking’s revenue relates to loans.
In addition to ranking among the top three commer-
cial banks nationally in market penetration and lead
share and being the No. 2 large middle-market lender
in the United States, Commercial Banking maintained
a favorable market position relative to peers in risk
management and deposit growth. We also are encour-
aged by the prospects for the Commercial Term
Lending business we acquired from WaMu and the
expansion of our middle-market model across the
West and Southeast footprints. As ever, client selection
is critical to our success, and Commercial Banking has
not only created more than 1,800 new relationships but
also has expanded nearly 10,000 existing relationships
– a sign of the continued vitality of our business.
That said, due to our clients’ waning loan demand and
higher credit losses, 2009 will be a tough year for the
Commercial Banking business. While we expect prob-
lems in commercial construction and real estate to
worsen for the rest of this year, we are fortunate to
have limited exposure and strong reserves. The turbu-
lence in the economy and its anticipated impact on the
broader Commercial Banking portfolio have led us to
shift into a recession-management mode and dedicate
many of our best resources into critically important
workout units, where expert senior managers are
involved on a daily basis.
Commercial Banking is a business with excellent long-
term value for us. We play a critical role in serving so
many great companies across this nation. And as this
important and vibrant sector of the economy grows,
so will we.
Treasury & Securities Services reported record net income
of $1.8 billion
Treasury & Securities Services (TSS) delivered excep-
tional financial results in 2008. Its net income has more
than doubled since 2005. For 2008, it stands at $1.8 bil-
lion (up 26%), with a 47% return on equity, on record
revenue (up 17%). We value this business tremendously
and appreciate how it has grown consistently over
time, produced good margins, and maintained great
global scale and long-standing client relationships.
The business maintains a leading position in holding,
valuing, clearing and servicing securities and providing
cash management, corporate card and liquidity prod-
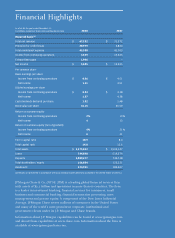
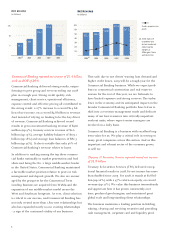
$52.2
30
40
50
60
$70
20
10
2004 2005 2007
(a) 2006
$54.2
$71.4
2008
$67.3
$62.0
$15
5
10
2004 2005 2006 2007
$6.5
$8.5
$14.4
$15.4
2008
$5.6
(a)
Net Income
(in billions)
Net Revenue
(in billions)
Pretax preprovision
profit
(a) 2004 data are
unaudited pro
forma combined,
reflecting the
merger of
JPMorgan Chase
and Bank One