Incredimail 2009 Annual Report Download - page 8
Download and view the complete annual report
Please find page 8 of the 2009 Incredimail annual report below. You can navigate through the pages in the report by either clicking on the pages listed below, or by using the keyword search tool below to find specific information within the annual report.-
 1
1 -
 2
2 -
 3
3 -
 4
4 -
 5
5 -
 6
6 -
 7
7 -
 8
8 -
 9
9 -
 10
10 -
 11
11 -
 12
12 -
 13
13 -
 14
14 -
 15
15 -
 16
16 -
 17
17 -
 18
18 -
 19
19 -
20
-
21
-
22
-
23
-
24
-
25
-
26
-
27
-
28
-
29
-
30
-
31
-
32
-
33
-
34
-
35
-
36
-
37
-
38
-
39
-
40
-
41
-
42
-
43
-
44
-
45
-
46
-
47
-
48
-
49
-
50
-
51
-
52
-
53
-
54
-
55
-
56
-
57
-
58
-
59
-
60
-
61
-
62
-
63
-
64
-
65
-
66
-
67
-
68
-
69
-
70
-
71
-
72
-
73
-
74
-
75
-
76
-
77
-
78
-
79
-
80
-
81
-
82
-
83
-
84
-
85
-
86
-
87
-
88
-
89
-
90
-
91
-
92
-
93
-
94
-
95
-
96
-
97
-
98
-
99
-
100
-
101
-
102
-
103
-
104
-
105
-
106
-
107
-
108
-
109
-
110
-
111
-
112
-
113
-
114
-
115
-
116
-
117
-
118
-
119
-
120
-
121
-
122
-
123
-
124
-
125
-
126
-
127
-
128
-
129
-
130
-
131
-
132
-
133
 |
 |

PART I
ITEM 1. IDENTITY OF DIRECTORS, SENIOR MANAGEMENT AND ADVISERS
Not applicable.
ITEM 2. OFFER STATISTICS AND EXPECTED TIMETABLE
Not applicable.
ITEM 3. KEY INFORMATION
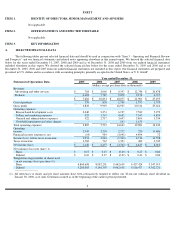
A. SELECTED FINANCIAL DATA
The following tables present selected financial data and should be read in conjunction with “Item 5 -
Operating and Financial Review
and Prospects”
and our financial statements and related notes appearing elsewhere in this annual report. We derived the selected financial data
below for the years ended December 31, 2007, 2008 and 2009 and as of December 31, 2008 and 2009 from our audited financial statements
included elsewhere in this report. We derived the selected financial data below for the years ended December 31, 2005 and 2006 and as of
December 31, 2005, 2006 and 2007 from our audited financial statements not included in this report. Our financial statements are prepared and
presented in U.S. dollars and in accordance with accounting principles generally accepted in the United States, or U.S. GAAP.
————————
Year ended December 31,
Statement of Operations Data:
2005
2006
2007
2008
2009
(dollars, except per share data, in thousands)
Revenues
Advertising and other services
$
784
$
3,066
$
9,597
$
12,748
$
20,478
Products
6,618
7,785
9,078
9,158
6,717
$
7,402
$
10,851
$
18,675
$
21,906
$
27,195
Cost of products
570
858
1,740
1,795
1,579
Gross profit
6,832
9,993
16,935
20,111
25,616
Operating expenses:
Research and development costs
2,040
3,251
6,125
7,589
5,972
Selling and marketing expenses
925
1,767
4,682
7,343
4,824
General and administrative expenses
922
2,717
3,693
3,806
3,334
Goodwill impairment and other charges
-
-
163
1,153
-
Total operating expenses
3,887
7,735
14,663
19,891
14,130
Operating
income
2,945
2,258
2,272
220
11,486
Financial income (expenses), net
(14
)
984
(3,641
)
4,494
72
Income (loss), before taxes on income
2,931
3,242
(1,369
)
4,714
11,558
Taxes on income
1,782
765
1,393
289
3,545
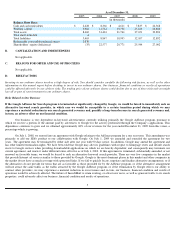
Net income (loss)
$
1,149
$
2,477
$
(2,762
)
$
4,425
$
8,013
Net earnings (loss) per share (1):
Basic
$
0.17
$
0.27
$
(0.29
)
$
0.47
$
0.86
Diluted
$
0.16
$
0.27
$
(0.29
)
$
0.46
$
0.84
Weighted average number of shares used
in net earnings (loss) per share (1):
Basic
4,869,698
8,982,201
9,442,658
9,427,424
9,347,915
Diluted
5,280,003
9,146,393
9,442,658
9,516,477
9,562,721
(
1)
All references to shares and per share amounts have been retroactively restated to reflect our 38
-
for
-
one ordinary share dividend on
January 30, 2006, as if such event had occurred as of the beginning of the earliest period presented.
4