Hyundai 2004 Annual Report Download - page 61
Download and view the complete annual report
Please find page 61 of the 2004 Hyundai annual report below. You can navigate through the pages in the report by either clicking on the pages listed below, or by using the keyword search tool below to find specific information within the annual report.-
 1
1 -
2
-
3
-
4
-
5
-
6
-
7
-
8
-
9
-
10
-
11
-
12
-
13
-
14
-
15
-
16
-
17
-
18
-
19
-
20
-
21
-
22
-
23
-
24
-
25
-
26
-
27
-
28
-
29
-
30
-
31
-
32
-
33
-
34
-
35
-
36
-
37
-
38
-
39
-
40
-
41
-
42
-
43
-
44
-
45
-
46
-
47
-
48
-
49
-
50
-
 51
51 -
 52
52 -
 53
53 -
 54
54 -
 55
55 -
 56
56 -
 57
57 -
 58
58 -
 59
59 -
 60
60 -
 61
61 -
 62
62 -
 63
63 -
 64
64 -
 65
65
 |
 |

Hyundai Motor Company Annual Report 2004_120
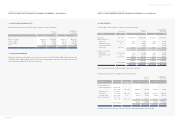
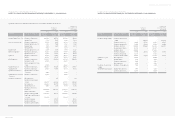
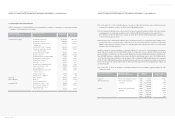
HYUNDAI MOTOR COMPANY AND SUBSIDIARIES
NOTES TO CONSOLIDATED FINANCIAL STATEMENTS DECEMBER 31, 2004 AND 2003
Consolidated Balance Sheet as of December 31, 2003
ASSETS Non-financial Financial Non-financial Financial
industry industry industry industry
Current assets: 18,052,541 1,454,071 $17,295,019 $1,393,055
Non-current assets:
Investments, net of
unamortized present value discount 6,152,022 514,252 5,893,870 492,673
Property, plant and equipment, net of
accumulated depreciation 17,709,142 133,755 16,966,031 128,142
Intangibles, net of amortization 1,851,280 9,486 1,773,596 9,088
Other financial business assets - 9,681,586 - 9,275,327
Total non-current assets 25,712,444 10,339,079 24,633,497 9,905,230
Total assets 43,764,985 11,793,150 $41,928,516 $11,298,285
LIABILITIES AND
SHAREHOLDERS’ EQUITY
Current liabilities 18,080,346 7,469,636 $17,321,658 $7,156,194
Non-current liabilities 9,287,739 3,350,055 8,898,006 3,209,480
Other financial business liabilities ----
Total liabilities 27,368,085 10,819,691 26,219,664 10,365,674
Shareholders’ equity:
Capital stock 1,478,603 1,153,978 1,416,558 1,105,555
Capital surplus 5,313,892 287,897 5,090,910 275,816
Retained earnings 5,524,904 (675,422) 5,293,067 (647,080)
Capital adjustments 279,970 207,006 268,222 198,320
Minority interests 3,799,531 - 3,640,095 -
Total shareholders’ equity 16,396,900 973,459 15,708,852 932,611
Total liabilities and shareholders’ equity 43,764,985 11,793,150 $41,928,516 $11,298,285
Korean won
(in millions)
Translation into
U. S. dollars (Note 2)
(in thousands)
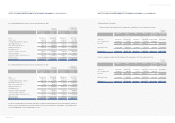
HYUNDAI MOTOR COMPANY AND SUBSIDIARIES
NOTES TO CONSOLIDATED FINANCIAL STATEMENTS DECEMBER 31, 2004 AND 2003
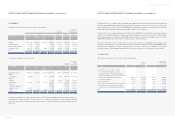
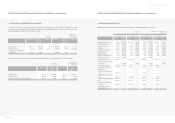
25. SEGMENT INFORMATION:
(1) Consolidated financial statements by industry
The consolidated balance sheets as of December 31, 2004 and 2003, and consolidated statements of income for the years then
ended, by industry under which the Company and its subsidiaries’ business are classified, are as follows:
Consolidated Balance Sheet as of December 31, 2004
ASSETS Non-financial Financial Non-financial Financial
industry industry industry industry
Current assets: 20,004,949 1,635,450 $19,165,500 $1,566,823
Non-current assets:
Investments, net of
unamortized present value discount 5,705,511 3,206,150 5,466,096 3,071,613
Property, plant and equipment, net of
accumulated depreciation 19,667,696 150,506 18,842,399 144,190
Intangibles, net of amortization 1,765,121 19,549 1,691,053 18,729
Other financial business assets - 7,813,618 - 7,485,743
Total non-current assets 27,138,328 11,189,823 25,999,548 10,720,275
Total assets 47,143,277 12,825,273 $45,165,048 $12,287,098
LIABILITIES AND
SHAREHOLDERS’ EQUITY
Current liabilities 19,252,339 7,606,850 $18,444,471 $7,287,651
Non-current liabilities 10,299,945 4,193,856 9,867,738 4,017,813
Other financial business liabilities ----
Total liabilities 29,552,284 11,800,706 28,312,209 11,305,524
Shareholders’ equity:
Capital stock 1,480,752 1,653,342 1,418,167 1,583,964
Capital surplus 5,168,673 296,732 4,951,785 284,281
Retained earnings 7,650,491 (1,159,206) 7,329,460 (1,110,564)
Capital adjustments (142,726) 233,699 (136,737) 223,893
Minority interests 3,433,803 - 3,289,714 -
Total shareholders’ equity 17,590,993 1,024,567 16,852,839 981,574
Total liabilities and shareholders’ equity 47,143,277 12,825,273 $45,165,048 $12,287,098
Korean won
(in millions)
Translation into
U. S. dollars (Note 2)
(in thousands)