Hyundai 2004 Annual Report Download - page 44
Download and view the complete annual report
Please find page 44 of the 2004 Hyundai annual report below. You can navigate through the pages in the report by either clicking on the pages listed below, or by using the keyword search tool below to find specific information within the annual report.-
 1
1 -
2
-
3
-
4
-
5
-
6
-
7
-
8
-
9
-
10
-
11
-
12
-
13
-
14
-
15
-
16
-
17
-
18
-
19
-
20
-
21
-
22
-
23
-
24
-
25
-
26
-
27
-
28
-
29
-
30
-
31
-
32
-
33
-
 34
34 -
 35
35 -
 36
36 -
 37
37 -
 38
38 -
 39
39 -
 40
40 -
 41
41 -
 42
42 -
 43
43 -
 44
44 -
 45
45 -
 46
46 -
 47
47 -
 48
48 -
 49
49 -
 50
50 -
 51
51 -
 52
52 -
 53
53 -
 54
54 -
55
-
56
-
57
-
58
-
59
-
60
-
61
-
62
-
63
-
64
-
65
 |
 |

Hyundai Motor Company Annual Report 2004_86
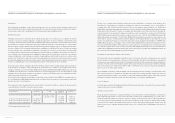
HYUNDAI MOTOR COMPANY AND SUBSIDIARIES
NOTES TO CONSOLIDATED FINANCIAL STATEMENTS DECEMBER 31, 2004 AND 2003
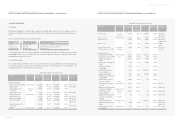
Trading securities and available-for-sale securities in short-term investment securities are stated at fair value with the resulting net gain
on valuation of trading securities amounting to 913 million (US$875 thousand) recognized in current operations, and the differences
between the acquisition costs and fair value of available-for-sale securities owned directly by the Company and the Company’s
ownership portion of such difference that occurred in the available-for-sale securities owned by its subsidiaries are recorded in capital
adjustments (see Note 16).
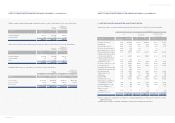
Short-term investment securities as of December 31, 2003 consist of the following:
Trading securities and available-for-sale securities in short-term investment securities are stated at fair value with the resulting net loss
on valuation of trading securities amounting to 28,534 million (US$23,822 thousand) recognized in current operations, and the
differences between the acquisition costs and fair value of available-for-sale securities owned directly by the Company and the
Company’s ownership portion of such difference that occurred in the available-for-sale securities owned by its subsidiaries are
recorded in capital adjustments (see Note 16).
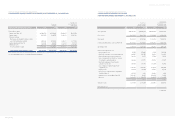
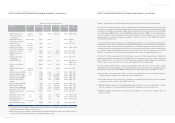
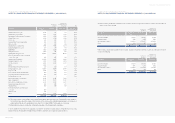
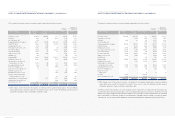
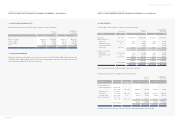
5. LONG-TERM INVESTMENT SECURITIES:
(1) Long-term investment securities as of December 31, 2004 and 2003 consist of the following:
Description Acquisition Book value Book value
cost
Trading securities
Beneficiary certificates 55,168 26,634 $25,516
Available-for-sale securities
Government bonds 58 58 56
Asset backed securities 11,993 11,993 11,490
Beneficiary certificates 158,666 212,147 203,245
Other 136,521 136,521 130,792
Held-to-maturity securities
Government bonds 6,445 6,445 6,174
368,851 393,798 $377,273
Korean won
(in millions)
Translation into
U.S. dollars (Note 2)
(in thousands)
Description 2004 2003 2004 2003
Available-for-sale securities
Equity securities stated at fair value 558,802 512,589 $535,353 $491,080
Equity securities stated at acquisition cost 192,608 173,243 184,526 165,973
Debt securities 2,120,040 1,704,053 2,031,079 1,632,547
2,871,450 2,389,885 2,750,958 2,289,600
Held-to-maturity securities
Debt securities 13,301 81,270 12,743 77,860
2,884,751 2,471,155 $2,763,701 $2,367,460
Korean won
(in millions)
Translation into
U. S. dollars (Note 2)
(in thousands)
HYUNDAI MOTOR COMPANY AND SUBSIDIARIES
NOTES TO CONSOLIDATED FINANCIAL STATEMENTS DECEMBER 31, 2004 AND 2003
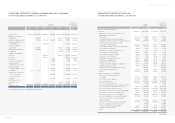
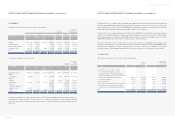
Reclassifications
For comparative purposes, certain accounts in the consolidated subsidiaries’ financial statements were reclassified to conform to the
Company’s financial statement presentation. Such reclassifications had no effect on the net income or the net equity reported in the
consolidated subsidiaries’ financial statements. Assets and liabilities in the financial industry are classified by method of current
arrangement. When method of current arrangement is impossible, assets and liabilities are classified to other financial assets and
liabilities. In addition, certain accounts in the consolidated financial statements of the prior period were reclassified for comparative
purposes. Such reclassifications had no effect on the consolidated net income or net equity in the accompanying financial statements
of the prior period.
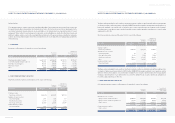
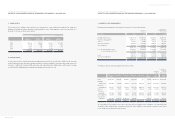
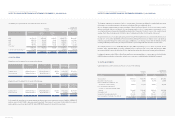
3. INVENTORIES:
Inventories as of December 31, 2004 and 2003 consist of the following:
Accounts 2004 2003 2004 2003
Finished goods and merchandise 4,297,037 2,844,499 $4,116,725 $2,725,137
Semi finished goods and work in process 794,303 829,780 760,972 794,961
Raw materials and supplies 866,274 650,427 829,923 623,134
Materials in transit 976,921 1,155,321 935,928 1,106,841
Other 6,007 18,502 5,755 17,726
6,940,542 5,498,529 $6,649,303 $5,267,799
Korean won
(in millions)
Translation into
U. S. dollars (Note 2)
(in thousands)
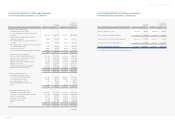
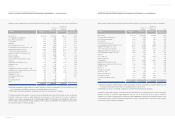
4. SHORT-TERM INVESTMENT SECURITIES:
Short-term investment securities as of December 31, 2004 consist of the following:
Description Acquisition Book value Book value
cost
Trading securities
Beneficiary certificates 240,396 241,309 $231,183
Available-for-sale securities
Government bonds 1,009 1,009 967
Asset backed securities 11,167 4,667 4,471
Beneficiary certificates 222,057 222,726 213,380
Held-to-maturity securities
Government bonds 1,507 1,507 1,444
476,136 471,218 $451,445
Korean won
(in millions)
Translation into
U.S. dollars (Note 2)
(in thousands)