Hyundai 2004 Annual Report Download - page 56
Download and view the complete annual report
Please find page 56 of the 2004 Hyundai annual report below. You can navigate through the pages in the report by either clicking on the pages listed below, or by using the keyword search tool below to find specific information within the annual report.-
 1
1 -
2
-
3
-
4
-
5
-
6
-
7
-
8
-
9
-
10
-
11
-
12
-
13
-
14
-
15
-
16
-
17
-
18
-
19
-
20
-
21
-
22
-
23
-
24
-
25
-
26
-
27
-
28
-
29
-
30
-
31
-
32
-
33
-
34
-
35
-
36
-
37
-
38
-
39
-
40
-
41
-
42
-
43
-
44
-
45
-
 46
46 -
 47
47 -
 48
48 -
 49
49 -
 50
50 -
 51
51 -
 52
52 -
 53
53 -
 54
54 -
 55
55 -
 56
56 -
 57
57 -
 58
58 -
 59
59 -
 60
60 -
 61
61 -
 62
62 -
 63
63 -
 64
64 -
 65
65
 |
 |

Hyundai Motor Company Annual Report 2004_110
HYUNDAI MOTOR COMPANY AND SUBSIDIARIES
NOTES TO CONSOLIDATED FINANCIAL STATEMENTS DECEMBER 31, 2004 AND 2003
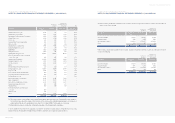
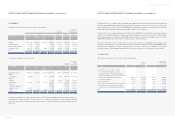
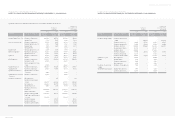
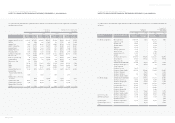
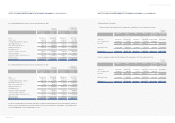
22. INTER-COMPANY TRANSACTIONS:
Significant transactions in 2004 and 2003 between the Company and consolidated subsidiaries are as follows:
Korean won
(in millions)
Translation into U. S. dollars (Note 2)
(in thousands)
Company’s Company’s Company’s Company’s Company’s Company’s Company’s Company’s
income expenses income expenses income expenses Income expenses
Hyundai Capital Service Inc. 1,000 35,737 13,476 1,949 $958 $34,237 $12,911 $1,867
KEFICO Corporation 19,297 337,208 65 310,959 18,487 323,058 62 297,911
Hyundai Powertech 17,604 179,653 28,489 151,647 16,865 172,114 27,294 145,284
Dymos Inc. 12,766 334,607 7,092 296,523 12,230 320,566 6,794 284,080
Kia Motors Corporation 1,008,767 355,184 979,937 415,209 966,437 340,280 938,817 397,786
Hyundai HYSCO 4,693 209,993 3,294 196,561 4,496 201,181 3,156 188,313
WIA Corporation 1,079 258,192 2,982 161,650 1,034 247,358 2,857 154,867
Autoever Systems Corp. 853 52,880 1,230 50,396 817 50,661 1,178 48,281
Aju Metal Co., Ltd. 2,236 5,890 - - 2,142 5,643 - -
Hyundai Motor America 6,227,807 - 6,424,304 - 5,966,475 - 6,154,727 -
Hyundai America Technical
Center Inc. - 30,417 - 26,476 - 29,141 - 25,365
Hyundai Motor India 432,282 15,037 267,171 75 414,143 14,406 255,960 72
Hyundai Motor Japan Co. 25,898 - 23,031 - 24,811 - 22,065 -
Hyundai Motor
Manufacturing Alabama,
LLC 51,608 - - - 49,442 - - -
Hyundai Motor Poland Sp.
Zo. O 145,667 - 87,350 - 139,555 - 83,685 -
Hyundai Motor Europe GmbH 2,276,451 - 972,411 - 2,180,926 - 931,607 -
HAC 726,549 - 742,206 - 696,062 - 711,062 -
Hyundai Motor Company
Australia 389,220 - 181,678 - 372,888 - 174,054 -
Hyundai Machine Tool
Europe GmbH 3,673 - 13,192 - 3,519 - 12,638 -
2004 2003 2004 2003
HYUNDAI MOTOR COMPANY AND SUBSIDIARIES
NOTES TO CONSOLIDATED FINANCIAL STATEMENTS DECEMBER 31, 2004 AND 2003
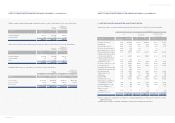
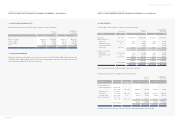
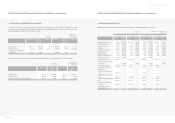
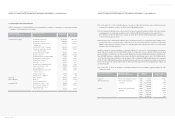
21. ELIMINATION OF UNREALIZED PROFITS AND LOSSES:
Unrealized profits and losses resulting from inter-company sales are calculated based on the average gross margin rate of selling
companies and are eliminated in the consolidated financial statements. Unrealized profits related to sales of inventories and property,
plant and equipment as of December 31, 2004 are as follows:
Inventories Property, Inventories Property,
plant and plant and
equipment equipment
Upstream sales 3,442 11,616 $3,298 $11,129
Downstream sales 338,234 24,269 324,041 23,251
Sales between consolidated subsidiaries 315,921 1,067 302,664 1,022
Inventories Property, Others Inventories Property, Others
plant and plant and
equipment equipment
Upstream sales 11,063 2,381 - $10,599 $2,281 $ -
Downstream sales 432,445 48,890 273,433 414,299 46,838 261,959
Sales between consolidated
subsidiaries 465,351 8,800 - 445,824 8,431 -
Unrealized profits related to sales of inventories and property, plant and equipment as of December 31, 2003 are as follows:
Korean won
(in millions)
Translation into
U. S. dollars (Note 2)
(in thousands)
Korean won
(in millions)
Translation into
U. S. dollars (Note 2)
(in thousands)