Hyundai 2004 Annual Report Download - page 34
Download and view the complete annual report
Please find page 34 of the 2004 Hyundai annual report below. You can navigate through the pages in the report by either clicking on the pages listed below, or by using the keyword search tool below to find specific information within the annual report.-
 1
1 -
2
-
3
-
4
-
5
-
6
-
7
-
8
-
9
-
10
-
11
-
12
-
13
-
14
-
15
-
16
-
17
-
18
-
19
-
20
-
21
-
22
-
23
-
 24
24 -
 25
25 -
 26
26 -
 27
27 -
 28
28 -
 29
29 -
 30
30 -
 31
31 -
 32
32 -
 33
33 -
 34
34 -
 35
35 -
 36
36 -
 37
37 -
 38
38 -
 39
39 -
 40
40 -
 41
41 -
 42
42 -
 43
43 -
 44
44 -
45
-
46
-
47
-
48
-
49
-
50
-
51
-
52
-
53
-
54
-
55
-
56
-
57
-
58
-
59
-
60
-
61
-
62
-
63
-
64
-
65
 |
 |

Hyundai Motor Company Annual Report 2004_66
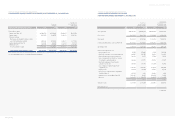
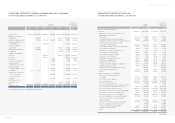
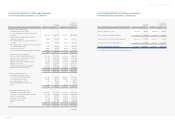
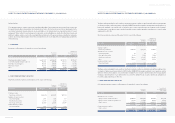
HYUNDAI MOTOR COMPANY AND SUBSIDIARIES
CONSOLIDATED STATEMENTS OF INCOME
FOR THE YEARS ENDED DECEMBER 31, 2004 AND 2003
Korean won
(in millions, except
per share amounts)
Translation into
U. S. dollars (Note 2)
(in thousands, except
per share amounts)
2004 2003 2004 2003
Sales (Note 25) 53,100,621 46,588,410 $50,872,409 $44,633,464
Cost of sales 39,419,561 32,801,126 37,765,435 31,424,723
Gross profit 13,681,060 13,787,284 13,106,974 13,208,741
Selling and administrative expenses (Note 18) 11,299,042 11,092,841 10,824,911 10,627,363
Operating income 2,382,018 2,694,443 2,282,063 2,581,378
Other income (expenses), net:
Interest expense, net (1,178) (47,804) (1,129) (45,798)
Gain (loss) on foreign currency translation, net 200,547 (65,155) 192,132 (62,421)
Gain on foreign currency transactions, net 184,966 26,877 177,204 25,749
Gain on valuation of investments accounted
for using the equity method, net 284,264 219,571 272,336 210,357
Gain (loss) on disposal of investments
and other assets, net (15,990) 118,791 (15,319) 113,806
Loss on disposal of property, plant and
equipment, net (137,193) (269,723) (131,436) (258,405)
Royalty income 202,630 140,208 194,127 134,325
Reversal of accrued warranties and product
liabilities (Note 2) 305,765 2,959 292,934 2,835
Impairment loss on intangibles (Note 10) (472,906) (3,232) (453,062) (3,096)
Other, net (212,975) (97,477) (204,037) (93,385)
337,930 25,015 323,750 23,967
Ordinary income 2,719,948 2,719,458 2,605,813 2,605,345
Extraordinary item - - - -
(continued)
HYUNDAI MOTOR COMPANY AND SUBSIDIARIES
CONSOLIDATED BALANCE SHEETS (CONTINUED) AS OF DECEMBER 31, 2004 AND 2003
Korean won
(in millions)
Translation into
U. S. dollars (Note 2)
(in thousands)
LIABILITIES AND SHAREHOLDERS’ EQUITY 2004 2003 2004 2003
Shareholders’ equity:
Capital stock (Note 15) 1,480,752 1,478,603 $1,418,617 $1,416,558
Capital surplus 5,161,875 5,328,775 4,945,272 5,105,169
Retained earnings
(Net income of 1,686,831 million in 2004
and 1,792,655 million in 2003) 6,530,244 5,188,818 6,256,221 4,971,084
Capital adjustments (Note 16) (139,065) (28,357) (133,230) (27,167)
Minority interests 4,096,029 3,461,008 3,924,151 3,315,777
Total shareholders’ equity 17,129,835 15,428,847 16,411,031 14,781,421
Total liabilities and shareholders’ equity 58,366,562 53,426,822 $55,917,381 $51,184,922
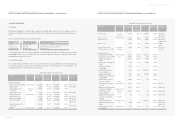
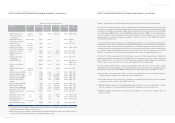
See accompanying notes to consolidated financial statements.