Huntington National Bank 2015 Annual Report Download - page 3
Download and view the complete annual report
Please find page 3 of the 2015 Huntington National Bank annual report below. You can navigate through the pages in the report by either clicking on the pages listed below, or by using the keyword search tool below to find specific information within the annual report.-
 1
1 -
 2
2 -
 3
3 -
 4
4 -
 5
5 -
 6
6 -
 7
7 -
 8
8 -
 9
9 -
 10
10 -
 11
11 -
 12
12 -
 13
13 -
 14
14 -
15
-
16
-
17
-
18
-
19
-
20
-
21
-
22
-
23
-
24
-
25
-
26
-
27
-
28
-
29
-
30
-
31
-
32
-
33
-
34
-
35
-
36
-
37
-
38
-
39
-
40
-
41
-
42
-
43
-
44
-
45
-
46
-
47
-
48
-
49
-
50
-
51
-
52
-
53
-
54
-
55
-
56
-
57
-
58
-
59
-
60
-
61
-
62
-
63
-
64
-
65
-
66
-
67
-
68
-
69
-
70
-
71
-
72
-
73
-
74
-
75
-
76
-
77
-
78
-
79
-
80
-
81
-
82
-
83
-
84
-
85
-
86
-
87
-
88
-
89
-
90
-
91
-
92
-
93
-
94
-
95
-
96
-
97
-
98
-
99
-
100
-
101
-
102
-
103
-
104
-
105
-
106
-
107
-
108
-
109
-
110
-
111
-
112
-
113
-
114
-
115
-
116
-
117
-
118
-
119
-
120
-
121
-
122
-
123
-
124
-
125
-
126
-
127
-
128
-
129
-
130
-
131
-
132
-
133
-
134
-
135
-
136
-
137
-
138
-
139
-
140
-
141
-
142
-
143
-
144
-
145
-
146
-
147
-
148
-
149
-
150
-
151
-
152
-
153
-
154
-
155
-
156
-
157
-
158
-
159
-
160
-
161
-
162
-
163
-
164
-
165
-
166
-
167
-
168
-
169
-
170
-
171
-
172
-
173
-
174
-
175
-
176
-
177
-
178
-
179
-
180
-
181
-
182
-
183
-
184
-
185
-
186
-
187
-
188
-
189
-
190
-
191
-
192
-
193
-
194
-
195
-
196
-
197
-
198
-
199
-
200
-
201
-
202
-
203
-
204
-
205
-
206
-
207
-
208
 |
 |
TO FELLOW SHAREOWNERS AND FRIENDS:
As I reflect back on the past year and look forward to the upcoming year, I am pleased to mark several
important achievements and upcoming milestones. In 2015, Huntington reported record earnings, as well as our
third consecutive year of share price outperformance. We continued to deliver on our commitment to be good
stewards of shareowners’ capital, executing our strategies and driving strong results within our aggregate
moderate-to-low risk appetite. Looking ahead to 2016, The Huntington National Bank is celebrating its 150th
Anniversary, and Huntington Bancshares is celebrating its 50th Anniversary. In addition, I am equally excited
about our recently announced acquisition of FirstMerit Corporation, which is scheduled to close later in 2016.
During 2015, my fellow shareowners were rewarded with a 5% increase in our common stock share price,
resulting in annual total shareholder return (capital appreciation plus reinvested dividends) of almost 8%. Both of
these measures outpaced the industry benchmarks — our third consecutive year of outperformance — and the
broader markets. Investors who purchased Huntington common stock at the beginning of 2010 have been
rewarded with an impressive 241% total shareholder return over the subsequent six years.
A Year of Record Earnings
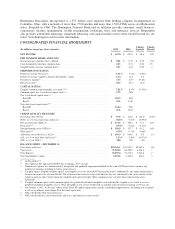
In 2015, we reported record net income of $693 million, a 10% increase over the prior year and 8% higher
than our previous record earnings in 2013. Earnings per common share increased 13% from the prior year, while
tangible book value per share increased 4%. This represented the fifth year in a row in which we earned a return
on average assets above 1% and the fourth year out of the last five in which we earned a return on average
tangible common equity above 12%. Our performance allowed us to return more than $450 million, or 65% of
our net income, to our shareowners through an increased cash dividend and a share repurchase program, while
continuing to invest in our businesses, and to support strong balance sheet growth.
In the fall of 2014, the Board of Directors adopted five long-term financial goals:
(1) annual revenue growth of 4% – 6%;
(2) annual revenue growth in excess of annual expense growth, or annual positive operating leverage in
financial vernacular;
(3) return on tangible common equity, or ROTCE, of 13% – 15%;
(4) efficiency ratio of 55% – 59%; and
(5) net charge-offs of 0.35% – 0.55%.
Our strong 2015 performance resulted in achieving the revenue growth, positive operating leverage, and net
charge-off long-term goals, while we just missed the ROTCE goal. The efficiency ratio remains a sizable
opportunity for improvement as we harvest the fruits of our many past investments in the franchise and continue
to drive positive operating leverage, which by definition will result in efficiency ratio improvement.
Strong core fundamentals were underlying our 2015 results. Total fully-taxable equivalent revenue
increased 6% year-over-year, driven by like increases in both net interest income and noninterest income. While
continuing to invest in our businesses, disciplined expense management remained paramount as noninterest
expense increased 5% for the year. We delivered on our commitment for positive operating leverage.
Revenue growth was supported by robust balance sheet growth, with average loans and leases increasing
7% from the prior year and average deposits increasing 10%. This growth helped to better leverage our balance
sheet, though our capital ratios remain strong with a 7.8% Tangible Common Equity (TCE) ratio and 9.8%
regulatory Common Equity Tier 1 (CET1) ratio at year end. Credit quality metrics also performed well and
consistent with our expectations for where we are in the credit cycle. Net charge-offs were only 0.18% for the
full year, which remains below our long-term expectations of 0.35% – 0.55%.
1