Huntington National Bank 2015 Annual Report Download - page 2
Download and view the complete annual report
Please find page 2 of the 2015 Huntington National Bank annual report below. You can navigate through the pages in the report by either clicking on the pages listed below, or by using the keyword search tool below to find specific information within the annual report.-
 1
1 -
 2
2 -
 3
3 -
 4
4 -
 5
5 -
 6
6 -
 7
7 -
 8
8 -
 9
9 -
 10
10 -
 11
11 -
 12
12 -
 13
13 -
14
-
15
-
16
-
17
-
18
-
19
-
20
-
21
-
22
-
23
-
24
-
25
-
26
-
27
-
28
-
29
-
30
-
31
-
32
-
33
-
34
-
35
-
36
-
37
-
38
-
39
-
40
-
41
-
42
-
43
-
44
-
45
-
46
-
47
-
48
-
49
-
50
-
51
-
52
-
53
-
54
-
55
-
56
-
57
-
58
-
59
-
60
-
61
-
62
-
63
-
64
-
65
-
66
-
67
-
68
-
69
-
70
-
71
-
72
-
73
-
74
-
75
-
76
-
77
-
78
-
79
-
80
-
81
-
82
-
83
-
84
-
85
-
86
-
87
-
88
-
89
-
90
-
91
-
92
-
93
-
94
-
95
-
96
-
97
-
98
-
99
-
100
-
101
-
102
-
103
-
104
-
105
-
106
-
107
-
108
-
109
-
110
-
111
-
112
-
113
-
114
-
115
-
116
-
117
-
118
-
119
-
120
-
121
-
122
-
123
-
124
-
125
-
126
-
127
-
128
-
129
-
130
-
131
-
132
-
133
-
134
-
135
-
136
-
137
-
138
-
139
-
140
-
141
-
142
-
143
-
144
-
145
-
146
-
147
-
148
-
149
-
150
-
151
-
152
-
153
-
154
-
155
-
156
-
157
-
158
-
159
-
160
-
161
-
162
-
163
-
164
-
165
-
166
-
167
-
168
-
169
-
170
-
171
-
172
-
173
-
174
-
175
-
176
-
177
-
178
-
179
-
180
-
181
-
182
-
183
-
184
-
185
-
186
-
187
-
188
-
189
-
190
-
191
-
192
-
193
-
194
-
195
-
196
-
197
-
198
-
199
-
200
-
201
-
202
-
203
-
204
-
205
-
206
-
207
-
208
 |
 |

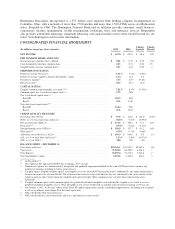
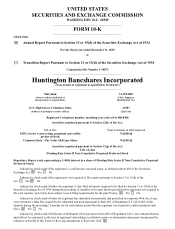
Huntington Bancshares Incorporated is a $71 billion asset regional bank holding company headquartered in
Columbus, Ohio, with a network of more than 750 branches and more than 1,500 ATMs across six Midwestern
states. Founded in 1866, The Huntington National Bank and its affiliates provide consumer, small business,
commercial, treasury management, wealth management, brokerage, trust, and insurance services. Huntington
also provides automobile financing, equipment financing, and capital market services that extend beyond its core
states. Visit huntington.com for more information.
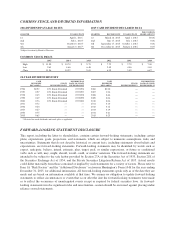
CONSOLIDATED FINANCIAL HIGHLIGHTS
(In millions, except per share amounts) 2015 2014
Change
Amount
Change
Percent
NET INCOME $ 693.0 $ 632.4 $ 60.6 10%
PER COMMON SHARE AMOUNTS
Net income per common share – diluted .......................................... $ 0.81 $ 0.72 $ 0.09 13%
Cash dividend declared per common share ........................................ 0.25 0.21 0.04 19
Tangible book value per common share(1) ......................................... 6.91 6.62 0.29 4
PERFORMANCE RATIOS
Return on average total assets .................................................. 1.01% 1.01% 0.00%
Return on average tangible common shareholders’ equity ............................ 12.4 11.8 0.6
Net interest margin(2) ......................................................... 3.15 3.23 (0.08)
Efficiency ratio(3) ............................................................ 64.5 65.1 (0.6)
CAPITAL RATIOS
Tangible common equity/tangible asset ratio(1)(4)(5) .................................. 7.81% 8.17% (0.36)%
Common equity tier 1 risk-based capital ratio(1)(6) ................................... 9.79 N/A
Tier 1 risk-based capital ratio(1)(6) ...............................................
Basel III ................................................................. 10.53 N/A
Basel I .................................................................. N/A 11.50
Total risk-based capital ratio(1)(6) ................................................
Basel III ................................................................. 12.64 N/A
Basel I .................................................................. N/A 13.56
CREDIT QUALITY MEASURES
Net charge-offs (NCOs) ....................................................... $ 87.8 $ 124.6 $ (36.8) (30)%
NCOs as a % of average loans and leases ......................................... 0.18% 0.27% (0.09)%
Non-accrual loans (NALs)(1) ................................................... $ 371.6 $ 300.2 $ 71.4 24%
NAL ratio(1)(7) ............................................................... 0.74% 0.63% 0.11%
Non-performing assets (NPAs)(1) ................................................ $ 398.9 $ 337.7 $ 61.2 18%
NPA ratio(1)(8) ............................................................... 0.79% 0.71% 0.08%
Allowance for credit losses (ACL)(1) ............................................. $ 669.9 $ 666.0 $ 3.9 1%
ACL as a % of total loans and leases(1) ........................................... 1.33% 1.40% (0.07)%
ACL as a % of NALs(1) ....................................................... 180 222 (42)
BALANCE SHEET – DECEMBER 31,
Total loans and leases ........................................................ $50,341.1 $47,655.7 $2,685.4 6%
Total assets ................................................................. 71,044.6 66,298.0 4,746.6 7
Total deposits ............................................................... 55,295.0 51,732.2 3,562.8 7
Total shareholders’ equity ..................................................... 6,594.6 6,328.2 266.4 4
(1) At December 31.
(2) On a fully-taxable equivalent (FTE) basis assuming a 35% tax rate.
(3) Noninterest expense less amortization of intangibles and goodwill impairment divided by the sum of FTE net interest income and
noninterest income excluding securities gains (losses).
(4) Tangible equity, tangible common equity, and tangible assets are non-GAAP financial measures. Additionally, any ratios utilizing these
financial measures are also non-GAAP. These financial measures have been included as they are considered to be critical metrics with
which to analyze and evaluate financial condition and capital strength. Other companies may calculate these financial measures
differently.
(5) Tangible common equity (total common equity less goodwill and other intangible assets) divided by tangible assets (total assets less
goodwill and other intangible assets). Other intangible assets are net of deferred tax liability and calculated assuming a 35% tax rate.
(6) On January 1, 2015, we became subject to the Basel III capital requirements and the standardized approach for calculating risk-weighted
assets in accordance with subpart D of the final capital rule.
(7) NALs divided by total loans and leases.
(8) NPAs divided by the sum of total loans and leases and other real estate owned.