Hamilton Beach 2007 Annual Report Download - page 6
Download and view the complete annual report
Please find page 6 of the 2007 Hamilton Beach annual report below. You can navigate through the pages in the report by either clicking on the pages listed below, or by using the keyword search tool below to find specific information within the annual report.-
 1
1 -
 2
2 -
 3
3 -
 4
4 -
 5
5 -
 6
6 -
 7
7 -
 8
8 -
 9
9 -
 10
10 -
 11
11 -
 12
12 -
 13
13 -
 14
14 -
 15
15 -
 16
16 -
 17
17 -
18
-
19
-
20
-
21
-
22
-
23
-
24
-
25
-
26
-
27
-
28
-
29
-
30
-
31
-
32
-
33
-
34
-
35
-
36
-
37
-
38
-
39
-
40
-
41
-
42
-
43
-
44
-
45
-
46
-
47
-
48
-
49
-
50
 |
 |

[2]
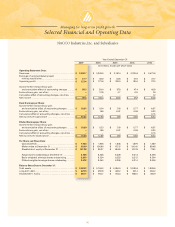
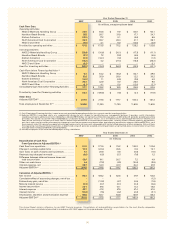
Selected Financial and Operating Data
Managing for long-term profit growth
NACCO Industries, Inc. and Subsidiaries
$ 2,782.6
$ 31.5
$ 88.0
$ 47.4
0.5
–
$ 47.9
$ 5.77
0.06
–
$ 5.83
$ 5.77
0.06
–
$ 5.83
$ 1.675
$ 105.40
$ 83.76
8.214
8.212
8.214
$ 2,038.6
$ 407.4
$ 688.0
$ 3,157.4
$ 33.8
$ 108.0
$ 57.8
4.7
–
$ 62.5
$ 7.03
0.57
–
$ 7.60
$ 7.03
0.57
–
$ 7.60
$ 1.848
$ 117.15
$ 85.50
8.226
8.223
8.226
$ 2,094.0
$ 406.2
$ 703.3
$ 2,472.6
$ 31.7
$ 117.2
$ 49.8
1.8
1.2
$ 52.8
$ 6.07
0.22
0.15
$ 6.44
$ 6.07
0.22
0.15
$ 6.44
$ 1.260
$ 89.48
$ 77.63
8.206
8.204
8.205
$ 1,839.8
$ 363.2
$ 637.0
$ 3,349.0
$ 36.0
$ 172.6
$ 93.4
12.8
–
$ 106.2
$ 11.34
1.56
–
$ 12.90
$ 11.33
1.56
–
$ 12.89
$ 1.905
$ 136.60
$ 96.27
8.238
8.234
8.242
$ 2,156.3
$ 359.9
$ 793.1
Year Ended December 31
2007 2006 2005 2004 2003
(In millions, except per share data)
Operating Statement Data :
Revenues . . . . . . . . . . . . . . . . . . . . . . . . . . . . . . . . . . . . . . . .
Earnings of unconsolidated project
mining subsidiaries . . . . . . . . . . . . . . . . . . . . . . . . . . . .
Operating profit . . . . . . . . . . . . . . . . . . . . . . . . . . . . . . . . .
Income before extraordinary gain
and cumulative effect of accounting changes . . . . .
Extraordinary gain, net-of-tax . . . . . . . . . . . . . . . . . . . . . .
Cumulative effect of accounting changes, net-of-tax . . . .
Net income . . . . . . . . . . . . . . . . . . . . . . . . . . . . . . . . . . . . . .
Basic Earnings per Share:
Income before extraordinary gain
and cumulative effect of accounting changes . . . . . .
Extraordinary gain, net-of-tax . . . . . . . . . . . . . . . . . . . . . .
Cumulative effect of accounting changes, net-of-tax . . .
Net income per basic share . . . . . . . . . . . . . . . . . . . . . .
Diluted Earnings per Share:
Income before extraordinary gain
and cumulative effect of accounting changes . . . . . .
Extraordinary gain, net-of-tax . . . . . . . . . . . . . . . . . . . . . .
Cumulative effect of accounting changes, net-of-tax . . .
Net income per diluted share . . . . . . . . . . . . . . . . . . . . .
Per Share and Share Data:
Cash dividends . . . . . . . . . . . . . . . . . . . . . . . . . . . . . . . . . .
Market value at December 31 . . . . . . . . . . . . . . . . . . . . . .
Stockholders’ equity at December 31 . . . . . . . . . . . . . .
Actual shares outstanding at December 31 . . . . . . . . . .
Basic weighted average shares outstanding . . . . . .
Diluted weighted average shares outstanding . . . . . .
Balance Sheet Data at December 31:
Total assets . . . . . . . . . . . . . . . . . . . . . . . . . . . . . . . . . . . . . .
Long-term debt . . . . . . . . . . . . . . . . . . . . . . . . . . . . . . . . . . .
Stockholders’ equity . . . . . . . . . . . . . . . . . . . . . . . . . . . . . .
$ 3,602.7
$ 37.7
$ 137.4
$ 89.3
–
–
$ 89.3
$ 10.81
–
–
$ 10.81
$ 10.80
–
–
$ 10.80
$ 1.980
$ 99.69
$ 107.88
8.269
8.263
8.272
$ 2,428.2
$ 439.5
$ 892.1