Hamilton Beach 2007 Annual Report Download - page 46
Download and view the complete annual report
Please find page 46 of the 2007 Hamilton Beach annual report below. You can navigate through the pages in the report by either clicking on the pages listed below, or by using the keyword search tool below to find specific information within the annual report.-
 1
1 -
2
-
3
-
4
-
5
-
6
-
7
-
8
-
9
-
10
-
11
-
12
-
13
-
14
-
15
-
16
-
17
-
18
-
19
-
20
-
21
-
22
-
23
-
24
-
25
-
26
-
27
-
28
-
29
-
30
-
31
-
32
-
33
-
34
-
35
-
 36
36 -
 37
37 -
 38
38 -
 39
39 -
 40
40 -
 41
41 -
 42
42 -
 43
43 -
 44
44 -
 45
45 -
 46
46 -
 47
47 -
 48
48 -
 49
49 -
 50
50
 |
 |

[42]
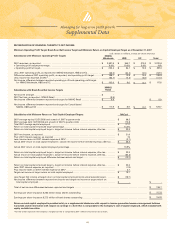
Supplemental Data
Managing for long-term profit growth
RECONCILIATION OF FINANCIAL TARGETS TO NET INCOME:
Minimum Operating Profit Target, Break-Even Net Income Target and Minimum Return on Capital Employed Target as of December 31, 2007
Subsidiaries with Minimum Operating Profit Targets
2007 revenues, as reported . . . . . . . . . . . . . . . . . . . . . . . . . . . . . . . . . . . . . . . . . . . . . . . . . . . . .
x Operating profit target percentage. . . . . . . . . . . . . . . . . . . . . . . . . . . . . . . . . . . . . . . . . . . . . .
= Operating profit at target. . . . . . . . . . . . . . . . . . . . . . . . . . . . . . . . . . . . . . . . . . . . . . . . . . . . . .
Less: 2007 operating profit, as reported for NMHG Wholesale, HBB and KC . . . . . . . . . . . .
Difference between 2007 operating profit, as reported, and operating profit target . . . . . .
Less: Income tax expense at 38%* . . . . . . . . . . . . . . . . . . . . . . . . . . . . . . . . . . . . . . . . . . . . . . .
Net income difference between reported operating profit and operating profit target
for NMHG Wholesale, HBB and KC. . . . . . . . . . . . . . . . . . . . . . . . . . . . . . . . . . . . . . . . . . . . .
Subsidiaries with Break-Even Net Income Targets
Net income at target . . . . . . . . . . . . . . . . . . . . . . . . . . . . . . . . . . . . . . . . . . . . . . . . . . . . . . . . . . .
2007 Net loss, as reported - NMHG Retail . . . . . . . . . . . . . . . . . . . . . . . . . . . . . . . . . . . . . . . . .
Net income difference between reported and target for NMHG Retail . . . . . . . . . . . . . . . . .
Net income difference between reported and target for Consolidated
NMHG, HBB and KC . . . . . . . . . . . . . . . . . . . . . . . . . . . . . . . . . . . . . . . . . . . . . . . . . . . . . . . . .
Subsidiaries with Minimum Return on Total Capital Employed Targets
2007 average equity (12/31/2006 and at each of 2007's quarter ends . . . . . . . . . . . . . . . . . . . . . . . . . . . . . . .
2007 average debt (12/31/2006 and at each of 2007's quarter ends) . . . . . . . . . . . . . . . . . . . . . . . . . . . . . . . .
Total 2007 average capital employed . . . . . . . . . . . . . . . . . . . . . . . . . . . . . . . . . . . . . . . . . . . . . . . . . . . . . . . . . .
Return on total capital employed target percentage. . . . . . . . . . . . . . . . . . . . . . . . . . . . . . . . . . . . . . . . . . . . . .
Return on total capital employed target = target net income before interest expense, after tax. . . . . . . . .
2007 net income, as reported. . . . . . . . . . . . . . . . . . . . . . . . . . . . . . . . . . . . . . . . . . . . . . . . . . . . . . . . . . . . . . . . .
Plus: 2007 interest expense, as reported . . . . . . . . . . . . . . . . . . . . . . . . . . . . . . . . . . . . . . . . . . . . . . . . . . . . . . .
Less: Income taxes on 2007 interest expense at 38%*. . . . . . . . . . . . . . . . . . . . . . . . . . . . . . . . . . . . . . . . . . . .
Actual 2007 return on total capital employed = actual net income before interest expense, after tax . . . .
Actual 2007 return on total capital employed percentage . . . . . . . . . . . . . . . . . . . . . . . . . . . . . . . . . . . . . . . . .
Return on total capital employed target = target net income before interest expense, after tax. . . . . . . . .
Actual return on total capital employed = actual net income before interest expense, after tax. . . . . . . . .
Return on total capital employed difference between actual and target . . . . . . . . . . . . . . . . . . . . . . . . . . . . .
Return on total capital employed target = target net income before interest expense, after tax. . . . . . . . .
Less: 2007 interest expense, as reported . . . . . . . . . . . . . . . . . . . . . . . . . . . . . . . . . . . . . . . . . . . . . . . . . . . . . . .
Plus: Income taxes on 2007 interest expense at 38%*. . . . . . . . . . . . . . . . . . . . . . . . . . . . . . . . . . . . . . . . . . . .
Target net income at target return on total capital employed . . . . . . . . . . . . . . . . . . . . . . . . . . . . . . . . . . . . . .
Less: Target Net income at target return on total capital employed since actual exceeds target. . . . . . . . .
Net income difference between reported net income and target net income at target return on
total capital employed. . . . . . . . . . . . . . . . . . . . . . . . . . . . . . . . . . . . . . . . . . . . . . . . . . . . . . . . . . . . . . . . . . . . .
Total of net income differences between reported and targets . . . . . . . . . . . . . . . . . . . . . . . . . . . . . . . . . . . . . . . . . . . . . . . . . . . . . . . . . . . . . . . . .
Earnings per share impact at 8.263 million basic shares outstanding . . . . . . . . . . . . . . . . . . . . . . . . . . . . . . . . . . . . . . . . . . . . . . . . . . . . . . . . . . .
Earnings per share impact at 8.272 million diluted shares outstanding . . . . . . . . . . . . . . . . . . . . . . . . . . . . . . . . . . . . . . . . . . . . . . . . . . . . . . . . . .
* Tax rate of 38% represents the Company's marginal tax rate as compared to 2007's effective income tax rate of 20.6%.
NMHG
Wholesale
$ 2,581.9
9.0%
$ 232.4
(66.3)
$ 166.1
(63.1)
$ 103.0
NMHG
Retail
$-
(8.9)
$ 8.9
$111.9
HBB
$ 540.7
10.0%
$ 54.1
(40.3)
$ 13.8
(5.2)
$ 8.6
$ 8.6
NACoal
$ 66.3
110.8
$ 177.1
13.0%
$ 23.0
$ 31.0
7.0
(2.7)
$ 35.3
19.9%
$ 23.0
(35.3)
$ (12.3)
$ 23.0
(7.0)
2.7
$ 18.7
$ (18.7)
$-
Total
$ 3,332.6
N/A
$ 297.0
(107.1)
$ 189.9
(72.1)
$117.8
$ 8.9
$ 126.7
$-
$ 126.7
$ 15.33
$ 15.32
KC
$ 210.0
5.0%
$ 10.5
(0.5)
$ 10.0
(3.8)
$ 6.2
$ 6.2
(U.S. dollars in millions, except per share amounts)
Return on total capital employed is provided solely as a supplemental disclosure with respect to income generation because management believes
it provides useful information with respect to earnings in a form that is comparable to the Company's cost of capital employed, which includes both
equity and debt securities.