Fannie Mae 2013 Annual Report Download - page 18
Download and view the complete annual report
Please find page 18 of the 2013 Fannie Mae annual report below. You can navigate through the pages in the report by either clicking on the pages listed below, or by using the keyword search tool below to find specific information within the annual report.-
 1
1 -
2
-
3
-
4
-
5
-
6
-
7
-
 8
8 -
 9
9 -
 10
10 -
 11
11 -
 12
12 -
 13
13 -
 14
14 -
 15
15 -
 16
16 -
 17
17 -
 18
18 -
 19
19 -
 20
20 -
 21
21 -
 22
22 -
 23
23 -
 24
24 -
 25
25 -
 26
26 -
 27
27 -
 28
28 -
29
-
30
-
31
-
32
-
33
-
34
-
35
-
36
-
37
-
38
-
39
-
40
-
41
-
42
-
43
-
44
-
45
-
46
-
47
-
48
-
49
-
50
-
51
-
52
-
53
-
54
-
55
-
56
-
57
-
58
-
59
-
60
-
61
-
62
-
63
-
64
-
65
-
66
-
67
-
68
-
69
-
70
-
71
-
72
-
73
-
74
-
75
-
76
-
77
-
78
-
79
-
80
-
81
-
82
-
83
-
84
-
85
-
86
-
87
-
88
-
89
-
90
-
91
-
92
-
93
-
94
-
95
-
96
-
97
-
98
-
99
-
100
-
101
-
102
-
103
-
104
-
105
-
106
-
107
-
108
-
109
-
110
-
111
-
112
-
113
-
114
-
115
-
116
-
117
-
118
-
119
-
120
-
121
-
122
-
123
-
124
-
125
-
126
-
127
-
128
-
129
-
130
-
131
-
132
-
133
-
134
-
135
-
136
-
137
-
138
-
139
-
140
-
141
-
142
-
143
-
144
-
145
-
146
-
147
-
148
-
149
-
150
-
151
-
152
-
153
-
154
-
155
-
156
-
157
-
158
-
159
-
160
-
161
-
162
-
163
-
164
-
165
-
166
-
167
-
168
-
169
-
170
-
171
-
172
-
173
-
174
-
175
-
176
-
177
-
178
-
179
-
180
-
181
-
182
-
183
-
184
-
185
-
186
-
187
-
188
-
189
-
190
-
191
-
192
-
193
-
194
-
195
-
196
-
197
-
198
-
199
-
200
-
201
-
202
-
203
-
204
-
205
-
206
-
207
-
208
-
209
-
210
-
211
-
212
-
213
-
214
-
215
-
216
-
217
-
218
-
219
-
220
-
221
-
222
-
223
-
224
-
225
-
226
-
227
-
228
-
229
-
230
-
231
-
232
-
233
-
234
-
235
-
236
-
237
-
238
-
239
-
240
-
241
-
242
-
243
-
244
-
245
-
246
-
247
-
248
-
249
-
250
-
251
-
252
-
253
-
254
-
255
-
256
-
257
-
258
-
259
-
260
-
261
-
262
-
263
-
264
-
265
-
266
-
267
-
268
-
269
-
270
-
271
-
272
-
273
-
274
-
275
-
276
-
277
-
278
-
279
-
280
-
281
-
282
-
283
-
284
-
285
-
286
-
287
-
288
-
289
-
290
-
291
-
292
-
293
-
294
-
295
-
296
-
297
-
298
-
299
-
300
-
301
-
302
-
303
-
304
-
305
-
306
-
307
-
308
-
309
-
310
-
311
-
312
-
313
-
314
-
315
-
316
-
317
-
318
-
319
-
320
-
321
-
322
-
323
-
324
-
325
-
326
-
327
-
328
-
329
-
330
-
331
-
332
-
333
-
334
-
335
-
336
-
337
-
338
-
339
-
340
-
341
 |
 |

13
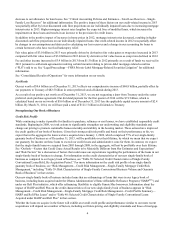
The table below presents several key indicators related to the total U.S. residential mortgage market.
Table 3: Housing and Mortgage Market Indicators(1)
% Change
2013 2012 2011 2013 vs.
2012 2012 vs.
2011
Home sales (units in thousands) . . . . . . . . . . . . . . . . . . . . . . . . . 5,518 5,028 4,566 9.7 % 10.1 %
New home sales . . . . . . . . . . . . . . . . . . . . . . . . . . . . . . . . . . . . 428 368 306 16.3 20.3
Existing home sales. . . . . . . . . . . . . . . . . . . . . . . . . . . . . . . . . . 5,090 4,660 4,260 9.2 9.4
Home price change based on Fannie Mae Home Price Index
(“HPI”)(2) . . . . . . . . . . . . . . . . . . . . . . . . . . . . . . . . . . . . . . . . . 8.8 % 4.2 % (3.6)%
Annual average fixed-rate mortgage interest rate(3) . . . . . . . . . . 4.0 % 3.7 % 4.5 %
Single-family mortgage originations (in billions). . . . . . . . . . . . $ 1,823 $ 2,153 $ 1,498 (15.3) 43.7
Type of single-family mortgage origination:
Refinance share. . . . . . . . . . . . . . . . . . . . . . . . . . . . . . . . . . . . . 62 % 72 % 66 %
Adjustable-rate mortgage share . . . . . . . . . . . . . . . . . . . . . . . . 7 % 5 % 6 %
Total U.S. residential mortgage debt outstanding (in billions)(4).$10,772 $10,811 $11,039 (0.4)(2.1)
__________
(1) The sources of the housing and mortgage market data in this table are the Federal Reserve Board, the U.S. Census Bureau, the
Department of Housing and Urban Development, the National Association of Realtors and the Mortgage Bankers Association. Home
sales data are based on information available through December 2013. Single-family mortgage originations, as well as refinance
shares, are based on January 2014 estimates from Fannie Mae’s Economic & Strategic Research group. The adjustable-rate mortgage
share is based on the number of conventional mortgage applications data reported by the Mortgage Bankers Association. Certain
previously reported data may have been changed to reflect revised historical data from any or all of these organizations.
(2) Calculated internally using property data information on loans purchased by Fannie Mae, Freddie Mac and other third-party home
sales data. Fannie Mae’s HPI is a weighted repeat transactions index, measuring average price changes in repeat sales on the same
properties. Fannie Mae’s HPI excludes prices on properties sold in foreclosure. The reported home price change reflects the
percentage change in Fannie Mae’s HPI from the fourth quarter of the prior year to the fourth quarter of the reported year.
(3) Based on the annual average 30-year fixed-rate mortgage interest rate reported by Freddie Mac.
(4) U.S. residential mortgage debt outstanding information for 2013 is provided as of September 30, 2013, the latest date for which
information was available.
Based on our home price index, we estimate that home prices on a national basis increased by 8.8% in 2013, following an
increase of 4.2% in 2012. Despite the recent increases in home prices, we estimate that, through December 31, 2013, home
prices on a national basis remained 13.5% below their peak in the third quarter of 2006. Our home price estimates are based
on preliminary data and are subject to change as additional data become available.
We estimate that total single-family mortgage originations decreased by approximately 15% to $1.82 trillion in 2013,
compared with $2.15 trillion in 2012, with a purchase share of 38% and a refinance share of 62%. The decline in single-
family mortgage originations in 2013 was driven by a decline in refinancings resulting from the overall increase in mortgage
rates since the beginning of May 2013. Thirty-year mortgage rates were 3.34% for the week of January 3, 2013 and increased
significantly during the year, primarily during the second half of the year, ending at 4.48% for the week of December 26,
2013.
Single-family mortgage debt outstanding declined steadily from the second quarter of 2008 to the second quarter of 2013, but
increased at a 0.5% annualized rate in the third quarter of 2013. Despite the increase in the third quarter, total U.S. residential
mortgage debt outstanding fell by 0.8% from the third quarter of 2012 to the third quarter of 2013.
Despite recent improvement in the housing market and declining delinquency rates, approximately one out of eleven
borrowers was delinquent or in foreclosure during the third quarter of 2013, according to the Mortgage Bankers Association
National Delinquency Survey.
Many homeowners continue to have “negative equity” in their homes as a result of declines in home prices since 2006, which
means their principal mortgage balance exceeds the current market value of their home. This increases the likelihood that
borrowers will abandon their mortgage obligations and that the loans will become delinquent and proceed to foreclosure.
According to CoreLogic, Inc. the number of residential properties with mortgages in a negative equity position in the third