Fannie Mae 2009 Annual Report Download - page 8
Download and view the complete annual report
Please find page 8 of the 2009 Fannie Mae annual report below. You can navigate through the pages in the report by either clicking on the pages listed below, or by using the keyword search tool below to find specific information within the annual report.-
 1
1 -
 2
2 -
 3
3 -
 4
4 -
 5
5 -
 6
6 -
 7
7 -
 8
8 -
 9
9 -
 10
10 -
 11
11 -
 12
12 -
 13
13 -
 14
14 -
 15
15 -
 16
16 -
 17
17 -
 18
18 -
 19
19 -
20
-
21
-
22
-
23
-
24
-
25
-
26
-
27
-
28
-
29
-
30
-
31
-
32
-
33
-
34
-
35
-
36
-
37
-
38
-
39
-
40
-
41
-
42
-
43
-
44
-
45
-
46
-
47
-
48
-
49
-
50
-
51
-
52
-
53
-
54
-
55
-
56
-
57
-
58
-
59
-
60
-
61
-
62
-
63
-
64
-
65
-
66
-
67
-
68
-
69
-
70
-
71
-
72
-
73
-
74
-
75
-
76
-
77
-
78
-
79
-
80
-
81
-
82
-
83
-
84
-
85
-
86
-
87
-
88
-
89
-
90
-
91
-
92
-
93
-
94
-
95
-
96
-
97
-
98
-
99
-
100
-
101
-
102
-
103
-
104
-
105
-
106
-
107
-
108
-
109
-
110
-
111
-
112
-
113
-
114
-
115
-
116
-
117
-
118
-
119
-
120
-
121
-
122
-
123
-
124
-
125
-
126
-
127
-
128
-
129
-
130
-
131
-
132
-
133
-
134
-
135
-
136
-
137
-
138
-
139
-
140
-
141
-
142
-
143
-
144
-
145
-
146
-
147
-
148
-
149
-
150
-
151
-
152
-
153
-
154
-
155
-
156
-
157
-
158
-
159
-
160
-
161
-
162
-
163
-
164
-
165
-
166
-
167
-
168
-
169
-
170
-
171
-
172
-
173
-
174
-
175
-
176
-
177
-
178
-
179
-
180
-
181
-
182
-
183
-
184
-
185
-
186
-
187
-
188
-
189
-
190
-
191
-
192
-
193
-
194
-
195
-
196
-
197
-
198
-
199
-
200
-
201
-
202
-
203
-
204
-
205
-
206
-
207
-
208
-
209
-
210
-
211
-
212
-
213
-
214
-
215
-
216
-
217
-
218
-
219
-
220
-
221
-
222
-
223
-
224
-
225
-
226
-
227
-
228
-
229
-
230
-
231
-
232
-
233
-
234
-
235
-
236
-
237
-
238
-
239
-
240
-
241
-
242
-
243
-
244
-
245
-
246
-
247
-
248
-
249
-
250
-
251
-
252
-
253
-
254
-
255
-
256
-
257
-
258
-
259
-
260
-
261
-
262
-
263
-
264
-
265
-
266
-
267
-
268
-
269
-
270
-
271
-
272
-
273
-
274
-
275
-
276
-
277
-
278
-
279
-
280
-
281
-
282
-
283
-
284
-
285
-
286
-
287
-
288
-
289
-
290
-
291
-
292
-
293
-
294
-
295
-
296
-
297
-
298
-
299
-
300
-
301
-
302
-
303
-
304
-
305
-
306
-
307
-
308
-
309
-
310
-
311
-
312
-
313
-
314
-
315
-
316
-
317
-
318
-
319
-
320
-
321
-
322
-
323
-
324
-
325
-
326
-
327
-
328
-
329
-
330
-
331
-
332
-
333
-
334
-
335
-
336
-
337
-
338
-
339
-
340
-
341
-
342
-
343
-
344
-
345
-
346
-
347
-
348
-
349
-
350
-
351
-
352
-
353
-
354
-
355
-
356
-
357
-
358
-
359
-
360
-
361
-
362
-
363
-
364
-
365
-
366
-
367
-
368
-
369
-
370
-
371
-
372
-
373
-
374
-
375
-
376
-
377
-
378
-
379
-
380
-
381
-
382
-
383
-
384
-
385
-
386
-
387
-
388
-
389
-
390
-
391
-
392
-
393
-
394
-
395
 |
 |

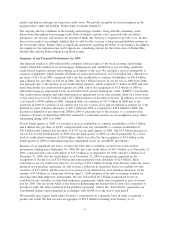
The table below presents several key indicators related to the total U.S. residential mortgage market.
Housing and Mortgage Market Indicators
(1)
2009 2008 2007 2009 2008
% Change
Home sales (units in thousands). . . . . . . . . . . . . . . . . . . . . . . . . . . . . 5,530 5,398 6,428 2.4% (16.0)%
New home sales . . . . . . . . . . . . . . . . . . . . . . . . . . . . . . . . . . . . . . 374 485 776 (22.9) (37.5)
Existing home sales . . . . . . . . . . . . . . . . . . . . . . . . . . . . . . . . . . . 5,156 4,913 5,652 4.9 (13.1)
Home price appreciation (depreciation) based on Fannie Mae House
Price Index (“HPI”)
(2)
. . . . . . . . . . . . . . . . . . . . . . . . . . . . . . . . . . (2.2)% (10.1)% (4.0)% — —
Home price appreciation (depreciation) based on FHFA Purchase Only
Index
(3)
. . . . . . . . . . . . . . . . . . . . . . . . . . . . . . . . . . . . . . . . . . . . (1.2)% (8.2)% (1.1)% — —
Annual average fixed-rate mortgage interest rate
(4)
. . . . . . . . . . . . . . . . 5.0% 6.0% 6.3% — —
Single-family mortgage originations (in billions) . . . . . . . . . . . . . . . . . $ 1,976 $ 1,580 $ 2,380 25.1 (33.6)
Type of single-family mortgage origination:
Refinance share . . . . . . . . . . . . . . . . . . . . . . . . . . . . . . . . . . . . . . 67% 52% 51% — —
Adjustable-rate mortgage share . . . . . . . . . . . . . . . . . . . . . . . . . . . 4% 11% 20% — —
Total U.S. residential mortgage debt outstanding (in billions)
(5)
. . . . . . . $11,764 $11,915 $11,957 (1.3) (0.4)
(1)
The sources of the housing and mortgage market data in this table are the Federal Reserve Board, the Bureau of the
Census, HUD, the National Association of Realtors, the Mortgage Bankers Association and FHFA. Single-family
mortgage originations, as well as the adjustable-rate mortgage and refinance shares, are based on February 2010
estimates from Fannie Mae’s Economics & Mortgage Market Analysis Group. Certain previously reported data may
have been changed to reflect revised historical data from any or all of these organizations.
(2)
Calculated internally using property data information on loans purchased by Fannie Mae, Freddie Mac and other
third-party home sales data. Fannie Mae’s HPI is a weighted repeat transactions index, meaning that it measures
average price changes in repeat sales on the same properties. Fannie Mae’s HPI excludes prices on properties sold in
foreclosure. The reported home price appreciation (depreciation) reflects the percentage change in Fannie Mae’s HPI
from the fourth quarter of the prior year to the fourth quarter of the reported year.
(3)
FHFA publishes a purchase-only House Price Index quarterly that is based solely on Fannie Mae and Freddie Mac
loans. As a result, it excludes loans in excess of conforming loan amounts and includes only a portion of total
subprime and Alt-A loans outstanding in the overall market. FHFA’s HPI is also a weighted repeat transactions index.
The reported home price appreciation (depreciation) reflects the percentage change in FHFA’s HPI from the fourth
quarter of the prior year to the fourth quarter of the reported year.
(4)
Based on the annual average 30-year fixed-rate mortgage interest rate reported by Freddie Mac.
(5)
Information for 2009 is through September 30, 2009 and has been obtained from The Federal Reserve’s September
2009 mortgage debt outstanding release.
Home prices, which rose slightly but consistently in the spring and summer, were relatively flat in the fourth
quarter of 2009. On average, national home prices declined by approximately 2.2% in 2009. We estimate that
home prices on a national basis have declined by approximately 16.4% from their peak in the third quarter of
2006. New home sales and housing starts remained sluggish throughout 2009. New home sales accounted for
just 5.6% of total home sales in the fourth quarter of 2009, down from a peak of more than 19% at the
beginning of 2005. Existing home sales rose throughout 2009, particularly during the third and fourth quarters
of 2009, boosted by government support, including the first-time and move up homebuyer tax credit, as well
as low mortgage interest rates and reduced home prices. The National Association of Realtors reported that
existing home sales increased by 13.9% in the fourth quarter of 2009—the highest level in nearly three years.
As a result of the increase in existing home sales, the number of unsold single-family homes in inventory
began to drop in the fourth quarter of 2009. However, the supply of homes as measured by the inventory/sales
ratio remains above long-term average levels. According to the National Association of Realtors, there was a
7.2 month average supply of existing unsold homes as of December 31, 2009, compared with a 9.4 month
average supply as of June 30, 2009 and as of December 31, 2008. This national average inventory/sales ratio
3