Fannie Mae 2009 Annual Report Download - page 4
Download and view the complete annual report
Please find page 4 of the 2009 Fannie Mae annual report below. You can navigate through the pages in the report by either clicking on the pages listed below, or by using the keyword search tool below to find specific information within the annual report.-
 1
1 -
 2
2 -
 3
3 -
 4
4 -
 5
5 -
 6
6 -
 7
7 -
 8
8 -
 9
9 -
 10
10 -
 11
11 -
 12
12 -
 13
13 -
 14
14 -
 15
15 -
16
-
17
-
18
-
19
-
20
-
21
-
22
-
23
-
24
-
25
-
26
-
27
-
28
-
29
-
30
-
31
-
32
-
33
-
34
-
35
-
36
-
37
-
38
-
39
-
40
-
41
-
42
-
43
-
44
-
45
-
46
-
47
-
48
-
49
-
50
-
51
-
52
-
53
-
54
-
55
-
56
-
57
-
58
-
59
-
60
-
61
-
62
-
63
-
64
-
65
-
66
-
67
-
68
-
69
-
70
-
71
-
72
-
73
-
74
-
75
-
76
-
77
-
78
-
79
-
80
-
81
-
82
-
83
-
84
-
85
-
86
-
87
-
88
-
89
-
90
-
91
-
92
-
93
-
94
-
95
-
96
-
97
-
98
-
99
-
100
-
101
-
102
-
103
-
104
-
105
-
106
-
107
-
108
-
109
-
110
-
111
-
112
-
113
-
114
-
115
-
116
-
117
-
118
-
119
-
120
-
121
-
122
-
123
-
124
-
125
-
126
-
127
-
128
-
129
-
130
-
131
-
132
-
133
-
134
-
135
-
136
-
137
-
138
-
139
-
140
-
141
-
142
-
143
-
144
-
145
-
146
-
147
-
148
-
149
-
150
-
151
-
152
-
153
-
154
-
155
-
156
-
157
-
158
-
159
-
160
-
161
-
162
-
163
-
164
-
165
-
166
-
167
-
168
-
169
-
170
-
171
-
172
-
173
-
174
-
175
-
176
-
177
-
178
-
179
-
180
-
181
-
182
-
183
-
184
-
185
-
186
-
187
-
188
-
189
-
190
-
191
-
192
-
193
-
194
-
195
-
196
-
197
-
198
-
199
-
200
-
201
-
202
-
203
-
204
-
205
-
206
-
207
-
208
-
209
-
210
-
211
-
212
-
213
-
214
-
215
-
216
-
217
-
218
-
219
-
220
-
221
-
222
-
223
-
224
-
225
-
226
-
227
-
228
-
229
-
230
-
231
-
232
-
233
-
234
-
235
-
236
-
237
-
238
-
239
-
240
-
241
-
242
-
243
-
244
-
245
-
246
-
247
-
248
-
249
-
250
-
251
-
252
-
253
-
254
-
255
-
256
-
257
-
258
-
259
-
260
-
261
-
262
-
263
-
264
-
265
-
266
-
267
-
268
-
269
-
270
-
271
-
272
-
273
-
274
-
275
-
276
-
277
-
278
-
279
-
280
-
281
-
282
-
283
-
284
-
285
-
286
-
287
-
288
-
289
-
290
-
291
-
292
-
293
-
294
-
295
-
296
-
297
-
298
-
299
-
300
-
301
-
302
-
303
-
304
-
305
-
306
-
307
-
308
-
309
-
310
-
311
-
312
-
313
-
314
-
315
-
316
-
317
-
318
-
319
-
320
-
321
-
322
-
323
-
324
-
325
-
326
-
327
-
328
-
329
-
330
-
331
-
332
-
333
-
334
-
335
-
336
-
337
-
338
-
339
-
340
-
341
-
342
-
343
-
344
-
345
-
346
-
347
-
348
-
349
-
350
-
351
-
352
-
353
-
354
-
355
-
356
-
357
-
358
-
359
-
360
-
361
-
362
-
363
-
364
-
365
-
366
-
367
-
368
-
369
-
370
-
371
-
372
-
373
-
374
-
375
-
376
-
377
-
378
-
379
-
380
-
381
-
382
-
383
-
384
-
385
-
386
-
387
-
388
-
389
-
390
-
391
-
392
-
393
-
394
-
395
 |
 |

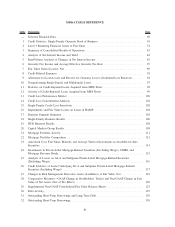
MD&A TABLE REFERENCE
Table Description Page
— Selected Financial Data ....................................................... 69
1 Credit Statistics, Single-Family Guaranty Book of Business............................. 10
2 Level 3 Recurring Financial Assets at Fair Value . . . ................................. 74
3 Summary of Consolidated Results of Operations ..................................... 83
4 Analysis of Net Interest Income and Yield ......................................... 84
5 Rate/Volume Analysis of Changes in Net Interest Income .............................. 85
6 Guaranty Fee Income and Average Effective Guaranty Fee Rate ......................... 87
7 Fair Value Gains (Losses), Net .................................................. 89
8 Credit-Related Expenses....................................................... 92
9 Allowance for Loan Losses and Reserve for Guaranty Losses (Combined Loss Reserves)....... 94
10 Nonperforming Single-Family and Multifamily Loans ................................. 97
11 Statistics on Credit-Impaired Loans Acquired from MBS Trusts ......................... 98
12 Activity of Credit-Impaired Loans Acquired from MBS Trusts .......................... 99
13 Credit Loss Performance Metrics ................................................ 100
14 Credit Loss Concentration Analysis .............................................. 101
15 Single-Family Credit Loss Sensitivity ............................................. 102
16 Impairments and Fair Value Losses on Loans in HAMP ............................... 104
17 Business Segment Summary .................................................... 105
18 Single-Family Business Results ................................................. 106
19 HCD Business Results ........................................................ 108
20 Capital Markets Group Results .................................................. 109
21 Mortgage Portfolio Activity .................................................... 111
22 Mortgage Portfolio Composition ................................................. 112
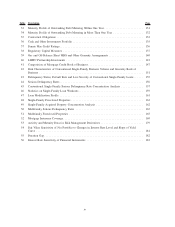
23 Amortized Cost, Fair Value, Maturity and Average Yield of Investments in Available-for-Sale
Securities.................................................................. 114
24 Investments in Private-Label Mortgage-Related Securities (Excluding Wraps), CMBS, and
Mortgage Revenue Bonds...................................................... 115
25 Analysis of Losses on Alt-A and Subprime Private-Label Mortgage-Related Securities
(Excluding Wraps) ........................................................... 116
26 Credit Statistics of Loans Underlying Alt-A and Subprime Private-Label Mortgage-Related
Securities (Including Wraps) ................................................... 117
27 Changes in Risk Management Derivative Assets (Liabilities) at Fair Value, Net .............. 119
28 Comparative Measures—GAAP Change in Stockholders’ Deficit and Non-GAAP Change in Fair
Value of Net Assets (Net of Tax Effect) ........................................... 120
29 Supplemental Non-GAAP Consolidated Fair Value Balance Sheets ....................... 123
30 Debt Activity ............................................................... 127
31 Outstanding Short-Term Borrowings and Long-Term Debt .............................. 129
32 Outstanding Short-Term Borrowings .............................................. 130
iii