Fannie Mae 2009 Annual Report Download - page 11
Download and view the complete annual report
Please find page 11 of the 2009 Fannie Mae annual report below. You can navigate through the pages in the report by either clicking on the pages listed below, or by using the keyword search tool below to find specific information within the annual report.-
 1
1 -
 2
2 -
 3
3 -
 4
4 -
 5
5 -
 6
6 -
 7
7 -
 8
8 -
 9
9 -
 10
10 -
 11
11 -
 12
12 -
 13
13 -
 14
14 -
 15
15 -
 16
16 -
 17
17 -
 18
18 -
 19
19 -
 20
20 -
 21
21 -
 22
22 -
23
-
24
-
25
-
26
-
27
-
28
-
29
-
30
-
31
-
32
-
33
-
34
-
35
-
36
-
37
-
38
-
39
-
40
-
41
-
42
-
43
-
44
-
45
-
46
-
47
-
48
-
49
-
50
-
51
-
52
-
53
-
54
-
55
-
56
-
57
-
58
-
59
-
60
-
61
-
62
-
63
-
64
-
65
-
66
-
67
-
68
-
69
-
70
-
71
-
72
-
73
-
74
-
75
-
76
-
77
-
78
-
79
-
80
-
81
-
82
-
83
-
84
-
85
-
86
-
87
-
88
-
89
-
90
-
91
-
92
-
93
-
94
-
95
-
96
-
97
-
98
-
99
-
100
-
101
-
102
-
103
-
104
-
105
-
106
-
107
-
108
-
109
-
110
-
111
-
112
-
113
-
114
-
115
-
116
-
117
-
118
-
119
-
120
-
121
-
122
-
123
-
124
-
125
-
126
-
127
-
128
-
129
-
130
-
131
-
132
-
133
-
134
-
135
-
136
-
137
-
138
-
139
-
140
-
141
-
142
-
143
-
144
-
145
-
146
-
147
-
148
-
149
-
150
-
151
-
152
-
153
-
154
-
155
-
156
-
157
-
158
-
159
-
160
-
161
-
162
-
163
-
164
-
165
-
166
-
167
-
168
-
169
-
170
-
171
-
172
-
173
-
174
-
175
-
176
-
177
-
178
-
179
-
180
-
181
-
182
-
183
-
184
-
185
-
186
-
187
-
188
-
189
-
190
-
191
-
192
-
193
-
194
-
195
-
196
-
197
-
198
-
199
-
200
-
201
-
202
-
203
-
204
-
205
-
206
-
207
-
208
-
209
-
210
-
211
-
212
-
213
-
214
-
215
-
216
-
217
-
218
-
219
-
220
-
221
-
222
-
223
-
224
-
225
-
226
-
227
-
228
-
229
-
230
-
231
-
232
-
233
-
234
-
235
-
236
-
237
-
238
-
239
-
240
-
241
-
242
-
243
-
244
-
245
-
246
-
247
-
248
-
249
-
250
-
251
-
252
-
253
-
254
-
255
-
256
-
257
-
258
-
259
-
260
-
261
-
262
-
263
-
264
-
265
-
266
-
267
-
268
-
269
-
270
-
271
-
272
-
273
-
274
-
275
-
276
-
277
-
278
-
279
-
280
-
281
-
282
-
283
-
284
-
285
-
286
-
287
-
288
-
289
-
290
-
291
-
292
-
293
-
294
-
295
-
296
-
297
-
298
-
299
-
300
-
301
-
302
-
303
-
304
-
305
-
306
-
307
-
308
-
309
-
310
-
311
-
312
-
313
-
314
-
315
-
316
-
317
-
318
-
319
-
320
-
321
-
322
-
323
-
324
-
325
-
326
-
327
-
328
-
329
-
330
-
331
-
332
-
333
-
334
-
335
-
336
-
337
-
338
-
339
-
340
-
341
-
342
-
343
-
344
-
345
-
346
-
347
-
348
-
349
-
350
-
351
-
352
-
353
-
354
-
355
-
356
-
357
-
358
-
359
-
360
-
361
-
362
-
363
-
364
-
365
-
366
-
367
-
368
-
369
-
370
-
371
-
372
-
373
-
374
-
375
-
376
-
377
-
378
-
379
-
380
-
381
-
382
-
383
-
384
-
385
-
386
-
387
-
388
-
389
-
390
-
391
-
392
-
393
-
394
-
395
 |
 |
market and help in reducing our long-term credit losses. We provide an update on our participation in the
program below under the heading “Homeowner Assistance Initiatives.”
The ongoing adverse conditions in the housing and mortgage markets, along with the continuing credit
deterioration throughout our mortgage credit book of business and the costs associated with our efforts
pursuant to our mission, will increase the amount of funds that Treasury is required to provide to us. In turn,
these factors make it exceedingly unlikely that we will be able to return to long-term profitability anytime in
the foreseeable future. Further, there is significant uncertainty regarding the future of our business. In addition,
our regulators, the Administration and Congress are considering options for the future state of Fannie Mae,
Freddie Mac and the Federal Home Loan Bank system.
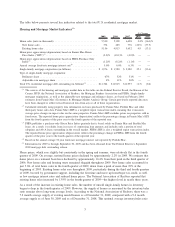
Summary of our Financial Performance for 2009
Our financial results for 2009 reflected the continued adverse impact of the weak economy and housing
market, which has resulted in record mortgage delinquencies and contributed to our recording significant
credit-related expenses and net losses during each quarter of the year. We recorded a net loss attributable to
common stockholders, which includes dividends on senior preferred stock, of $74.4 billion and a diluted loss
per share of $13.11 in 2009, compared with a net loss attributable to common stockholders of $59.8 billion
and a diluted loss per share of $24.04 in 2008. The $14.7 billion increase in our net loss in 2009 from 2008
was primarily due to the increase in our credit-related expenses, which totaled $73.5 billion in 2009 and were
more than double our credit-related expenses for 2008, and to our recognition of $5.5 billion in 2009 in
other-than-temporary impairment losses on our federal low-income housing tax credit (“LIHTC”) investments.
Our credit-related expenses and other-than-temporary impairment losses were partially offset by a lower level
of fair value losses of $17.3 billion and a $5.7 billion increase in net interest income. In addition, we recorded
a tax benefit of $985 million in 2009, compared with a tax expense of $13.7 billion in 2008 due to the
carryback in 2009 of a portion of our current year tax loss to prior years and recognition of expense for a net
deferred tax asset valuation allowance of $25.7 billion in 2009 as compared to $30.8 billion in 2008. The
decrease in diluted loss per share from 2008 to 2009 is primarily due to the issuance of a common stock
warrant to Treasury in September 2008 that resulted in a substantial increase in our weighted-average shares
outstanding during 2009 over 2008.
For the fourth quarter of 2009, we recorded a net loss attributable to common stockholders of $16.3 billion
and a diluted loss per share of $2.87, compared with a net loss attributable to common stockholders of
$19.8 billion and a diluted loss per share of $3.47 for the third quarter of 2009. The $3.4 billion decrease in
our net loss for the fourth quarter of 2009 from the third quarter of 2009 was driven principally by a lower
level of credit-related expenses of $10.0 billion, which was offset by the recognition of $5.0 billion in the
fourth quarter of 2009 in other-than-temporary impairment losses on our LIHTC investments.
Because of our significant net losses, we have not been able to maintain a positive net worth without
government funding since September 30, 2008. We had a net worth deficit of $15.3 billion as of December 31,
2009, compared with a net worth deficit of $15.0 billion as of September 30, 2009, and $15.2 billion as of
December 31, 2008. Our net worth deficit as of December 31, 2009 was negatively impacted by the
recognition of our net loss of $72.0 billion and senior preferred stock dividends of $2.5 billion. These
reductions in our net worth were offset by our receipt of $59.9 billion in funds from Treasury under the senior
preferred stock purchase agreement, as well as from a reduction in unrealized losses on available-for-sale
securities of $4.9 billion and the reversal of a portion of our deferred tax asset valuation allowance, in the
amount of $3.0 billion, in connection with our April 1, 2009 adoption of the new accounting standard for
assessing other-than-temporary impairments. We also reclassified $6.4 billion in unrealized losses on
available-for-sale securities to other-than-temporary impairments, which were recognized as part of our net
loss for 2009. Our net worth, which is the basis for determining the amount that Treasury has committed to
provide us under the senior preferred stock purchase agreement, reflects the “Total deficit” reported in our
consolidated balance sheets prepared in accordance with GAAP as of the end of each period.
We generally may request funds under Treasury’s commitment on a quarterly basis in order to maintain a
positive net worth. We had received an aggregate of $59.9 billion in funding from Treasury as of
6