Fannie Mae 2009 Annual Report Download - page 18
Download and view the complete annual report
Please find page 18 of the 2009 Fannie Mae annual report below. You can navigate through the pages in the report by either clicking on the pages listed below, or by using the keyword search tool below to find specific information within the annual report.-
 1
1 -
2
-
3
-
4
-
5
-
6
-
7
-
 8
8 -
 9
9 -
 10
10 -
 11
11 -
 12
12 -
 13
13 -
 14
14 -
 15
15 -
 16
16 -
 17
17 -
 18
18 -
 19
19 -
 20
20 -
 21
21 -
 22
22 -
 23
23 -
 24
24 -
 25
25 -
 26
26 -
 27
27 -
 28
28 -
29
-
30
-
31
-
32
-
33
-
34
-
35
-
36
-
37
-
38
-
39
-
40
-
41
-
42
-
43
-
44
-
45
-
46
-
47
-
48
-
49
-
50
-
51
-
52
-
53
-
54
-
55
-
56
-
57
-
58
-
59
-
60
-
61
-
62
-
63
-
64
-
65
-
66
-
67
-
68
-
69
-
70
-
71
-
72
-
73
-
74
-
75
-
76
-
77
-
78
-
79
-
80
-
81
-
82
-
83
-
84
-
85
-
86
-
87
-
88
-
89
-
90
-
91
-
92
-
93
-
94
-
95
-
96
-
97
-
98
-
99
-
100
-
101
-
102
-
103
-
104
-
105
-
106
-
107
-
108
-
109
-
110
-
111
-
112
-
113
-
114
-
115
-
116
-
117
-
118
-
119
-
120
-
121
-
122
-
123
-
124
-
125
-
126
-
127
-
128
-
129
-
130
-
131
-
132
-
133
-
134
-
135
-
136
-
137
-
138
-
139
-
140
-
141
-
142
-
143
-
144
-
145
-
146
-
147
-
148
-
149
-
150
-
151
-
152
-
153
-
154
-
155
-
156
-
157
-
158
-
159
-
160
-
161
-
162
-
163
-
164
-
165
-
166
-
167
-
168
-
169
-
170
-
171
-
172
-
173
-
174
-
175
-
176
-
177
-
178
-
179
-
180
-
181
-
182
-
183
-
184
-
185
-
186
-
187
-
188
-
189
-
190
-
191
-
192
-
193
-
194
-
195
-
196
-
197
-
198
-
199
-
200
-
201
-
202
-
203
-
204
-
205
-
206
-
207
-
208
-
209
-
210
-
211
-
212
-
213
-
214
-
215
-
216
-
217
-
218
-
219
-
220
-
221
-
222
-
223
-
224
-
225
-
226
-
227
-
228
-
229
-
230
-
231
-
232
-
233
-
234
-
235
-
236
-
237
-
238
-
239
-
240
-
241
-
242
-
243
-
244
-
245
-
246
-
247
-
248
-
249
-
250
-
251
-
252
-
253
-
254
-
255
-
256
-
257
-
258
-
259
-
260
-
261
-
262
-
263
-
264
-
265
-
266
-
267
-
268
-
269
-
270
-
271
-
272
-
273
-
274
-
275
-
276
-
277
-
278
-
279
-
280
-
281
-
282
-
283
-
284
-
285
-
286
-
287
-
288
-
289
-
290
-
291
-
292
-
293
-
294
-
295
-
296
-
297
-
298
-
299
-
300
-
301
-
302
-
303
-
304
-
305
-
306
-
307
-
308
-
309
-
310
-
311
-
312
-
313
-
314
-
315
-
316
-
317
-
318
-
319
-
320
-
321
-
322
-
323
-
324
-
325
-
326
-
327
-
328
-
329
-
330
-
331
-
332
-
333
-
334
-
335
-
336
-
337
-
338
-
339
-
340
-
341
-
342
-
343
-
344
-
345
-
346
-
347
-
348
-
349
-
350
-
351
-
352
-
353
-
354
-
355
-
356
-
357
-
358
-
359
-
360
-
361
-
362
-
363
-
364
-
365
-
366
-
367
-
368
-
369
-
370
-
371
-
372
-
373
-
374
-
375
-
376
-
377
-
378
-
379
-
380
-
381
-
382
-
383
-
384
-
385
-
386
-
387
-
388
-
389
-
390
-
391
-
392
-
393
-
394
-
395
 |
 |
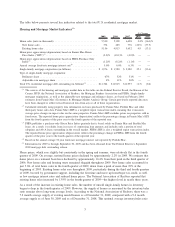
Home Retention Strategies
In 2009, we completed home retention workouts for over 160,000 loans with an aggregate unpaid principal
balance of $27.7 billion. On a loan count basis, this represented a 43% increase over home retention workouts
completed in 2008. Loan modifications were the most significant driver of the increase in home retention
workouts from 2008 to 2009 as we experienced a shift in our approach to workouts to address the increasing
number of borrowers facing long-term, rather than short-term, financial hardships. Our loan modifications in
2009 targeted permanent changes to loan terms to further increase the likelihood of long-term home retention,
in contrast to HomeSaver Advance Loans, which are unsecured personal loans in the amount of past due
payments on a borrower’s mortgage loan used to bring the mortgage loan current. We provided fewer
HomeSaver Advance loans in 2009 than in 2008.
Not counting trial modifications under HAMP, in 2009 we completed approximately 99,000 loan
modifications, an increase of 195% over 2008. Loan modifications represented 61% of home retention
workouts completed in 2009 compared with 30% in 2008.
In 2009, the characteristics of our modifications changed notably, with 93% of modifications involving term
extensions, interest rate reductions, or a combination of both, compared with 57% in 2008. As a result,
approximately 58% of modifications completed in 2009 resulted in a reduction in initial monthly payments of
greater than 20%, compared with 13% for modifications completed in 2008. This level of payment reduction
should provide valuable assistance to borrowers in sustaining home ownership and, in turn, should help us
reduce borrower defaults, which are costly for us.
Our modification statistics do not include HAMP trial modifications until they become permanent
modifications. HAMP was our primary loan modification program in 2009; however, many of the trial
modifications entered into during 2009 have not yet converted to a permanent modification solution due to the
fact that the trial period is still underway or the trial period has been extended for servicers to obtain
documents and perform final modification underwriting. A borrower receives payment relief during the HAMP
trial period to the extent that the borrower pays according to the trial modification plan. While HAMP is the
first home retention workout that servicers must consider for borrowers, we continued to complete
modifications for those borrowers who did not qualify for HAMP, with the vast majority of our modifications
in 2009 completed through our standard modification approaches. Including HAMP trials entered into during
2009, our HAMP efforts represented the vast majority of our total foreclosure prevention actions. As of
December 31, 2009, 291,053 of our loans were in trial modification periods under HAMP, as reported by
servicers to the system of record for the program. The number of our HAMP trials increased substantially in
the third and fourth quarters of 2009, and we expect our permanent HAMP modifications to increase
significantly as trial periods are completed and permanent modification offers are extended. However, it is
difficult to predict how many trial modifications for our loans under HAMP will ultimately convert to
permanent loan modifications.
Foreclosure Alternatives
If we are unable to provide a viable home retention option through HAMP or other programs, we may offer
foreclosure alternatives, including preforeclosure sales and deeds-in-lieu of foreclosure. In 2009, our total
volume of preforeclosure sales and deeds-in-lieu of foreclosures increased by 239% to approximately 40,000
in 2009 compared with approximately 12,000 in 2008. We have increasingly relied on foreclosure alternatives,
primarily preforeclosure sales and deeds-in-lieu of foreclosure, as a growing number of borrowers have faced
longer-term economic hardships that cannot be solved through a home retention solution.
Providing Mortgage Market Liquidity
In 2009, we purchased or guaranteed an estimated $823.6 billion in new business, measured by unpaid
principal balance, which included financing for approximately 3,125,000 conventional single-family loans and
approximately 372,000 multifamily units. The $823.6 billion in new single-family and multifamily business in
2009 consisted of $496.0 billion in Fannie Mae MBS acquired by third parties, and $327.6 billion in mortgage
loans and mortgage-related securities that we purchased for our mortgage investment portfolio.
13