Fannie Mae 2009 Annual Report Download - page 16
Download and view the complete annual report
Please find page 16 of the 2009 Fannie Mae annual report below. You can navigate through the pages in the report by either clicking on the pages listed below, or by using the keyword search tool below to find specific information within the annual report.-
 1
1 -
2
-
3
-
4
-
5
-
 6
6 -
 7
7 -
 8
8 -
 9
9 -
 10
10 -
 11
11 -
 12
12 -
 13
13 -
 14
14 -
 15
15 -
 16
16 -
 17
17 -
 18
18 -
 19
19 -
 20
20 -
 21
21 -
 22
22 -
 23
23 -
 24
24 -
 25
25 -
 26
26 -
27
-
28
-
29
-
30
-
31
-
32
-
33
-
34
-
35
-
36
-
37
-
38
-
39
-
40
-
41
-
42
-
43
-
44
-
45
-
46
-
47
-
48
-
49
-
50
-
51
-
52
-
53
-
54
-
55
-
56
-
57
-
58
-
59
-
60
-
61
-
62
-
63
-
64
-
65
-
66
-
67
-
68
-
69
-
70
-
71
-
72
-
73
-
74
-
75
-
76
-
77
-
78
-
79
-
80
-
81
-
82
-
83
-
84
-
85
-
86
-
87
-
88
-
89
-
90
-
91
-
92
-
93
-
94
-
95
-
96
-
97
-
98
-
99
-
100
-
101
-
102
-
103
-
104
-
105
-
106
-
107
-
108
-
109
-
110
-
111
-
112
-
113
-
114
-
115
-
116
-
117
-
118
-
119
-
120
-
121
-
122
-
123
-
124
-
125
-
126
-
127
-
128
-
129
-
130
-
131
-
132
-
133
-
134
-
135
-
136
-
137
-
138
-
139
-
140
-
141
-
142
-
143
-
144
-
145
-
146
-
147
-
148
-
149
-
150
-
151
-
152
-
153
-
154
-
155
-
156
-
157
-
158
-
159
-
160
-
161
-
162
-
163
-
164
-
165
-
166
-
167
-
168
-
169
-
170
-
171
-
172
-
173
-
174
-
175
-
176
-
177
-
178
-
179
-
180
-
181
-
182
-
183
-
184
-
185
-
186
-
187
-
188
-
189
-
190
-
191
-
192
-
193
-
194
-
195
-
196
-
197
-
198
-
199
-
200
-
201
-
202
-
203
-
204
-
205
-
206
-
207
-
208
-
209
-
210
-
211
-
212
-
213
-
214
-
215
-
216
-
217
-
218
-
219
-
220
-
221
-
222
-
223
-
224
-
225
-
226
-
227
-
228
-
229
-
230
-
231
-
232
-
233
-
234
-
235
-
236
-
237
-
238
-
239
-
240
-
241
-
242
-
243
-
244
-
245
-
246
-
247
-
248
-
249
-
250
-
251
-
252
-
253
-
254
-
255
-
256
-
257
-
258
-
259
-
260
-
261
-
262
-
263
-
264
-
265
-
266
-
267
-
268
-
269
-
270
-
271
-
272
-
273
-
274
-
275
-
276
-
277
-
278
-
279
-
280
-
281
-
282
-
283
-
284
-
285
-
286
-
287
-
288
-
289
-
290
-
291
-
292
-
293
-
294
-
295
-
296
-
297
-
298
-
299
-
300
-
301
-
302
-
303
-
304
-
305
-
306
-
307
-
308
-
309
-
310
-
311
-
312
-
313
-
314
-
315
-
316
-
317
-
318
-
319
-
320
-
321
-
322
-
323
-
324
-
325
-
326
-
327
-
328
-
329
-
330
-
331
-
332
-
333
-
334
-
335
-
336
-
337
-
338
-
339
-
340
-
341
-
342
-
343
-
344
-
345
-
346
-
347
-
348
-
349
-
350
-
351
-
352
-
353
-
354
-
355
-
356
-
357
-
358
-
359
-
360
-
361
-
362
-
363
-
364
-
365
-
366
-
367
-
368
-
369
-
370
-
371
-
372
-
373
-
374
-
375
-
376
-
377
-
378
-
379
-
380
-
381
-
382
-
383
-
384
-
385
-
386
-
387
-
388
-
389
-
390
-
391
-
392
-
393
-
394
-
395
 |
 |
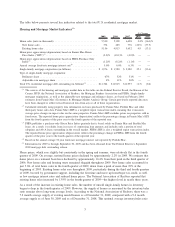
Table 1 does not include information about trial modifications under HAMP that have not yet become
permanent modifications or repayment and forbearance plans that have been initiated but not completed. As of
December 31, 2009, 291,053 of our loans were in trial modification periods under HAMP, as reported by
servicers to the system of record for the program.
Our single-family serious delinquency rate of 5.38% as of December 31, 2009 was more than double the rate
of 2.42% at the end of 2008. In addition, our seriously delinquent loan population aged significantly during
2009. The increase in delinquencies during 2009 was primarily driven by the duration and depth of the decline
in home prices and the rise in unemployment and underemployment among borrowers. These factors adversely
affected not only higher risk loan categories, but also loans traditionally considered to have a lower risk of
default, such as loans with lower original LTV ratios and higher FICO credit scores, fixed-rate mortgages and
loans past the peak default period of two to six years. Certain loan categories, however, continued to
contribute disproportionately to the increase in our nonperforming loans and credit losses in 2009. These
categories include: loans on properties in certain Midwest states, California, Florida, Arizona and Nevada;
loans originated in 2006 and 2007; and loans related to higher-risk product types, such as Alt-A loans. The
duration and depth of the decline in home prices and the rise in unemployment also contributed to the aging
of our seriously delinquent loan population. In addition, our foreclosure prevention efforts have, by design,
contributed to the rise in and aging of our delinquencies as we have delayed some foreclosure proceedings
until the borrower has been sufficiently considered for a home retention solution.
The decline in home prices has made it more difficult for delinquent borrowers to sell their homes and resolve
all their mortgage delinquencies. Approximately 14% of the loans in our guaranty book of business had
mark-to-market LTV ratios of 100% or greater at the end of 2009, compared with approximately 12% at the
end of 2008. As a result of the decline in home prices, our average credit loss severity, and average initial
charge-off per default, increased during 2009.
The substantial increase in our loss reserves at December 31, 2009 compared with the prior year was driven
by further deterioration of our credit book and reflects our estimate of the losses inherent in our guaranty book
of business as of the end of each period. Higher provisions for credit losses, through which we maintain
appropriate loss reserves, were the major driver of the $73.5 billion in credit-related expenses we recognized
in 2009, compared with the $29.8 billion we recognized in 2008. Our loss reserve coverage to total
nonperforming loans increased to 29.98% as of December 31, 2009, from 20.76% as of December 31, 2008.
We experienced a significant increase in our credit losses in 2009; however, the level of our credit losses was
substantially lower than our credit-related expenses, due in part to the delays in foreclosures (that is, charge-
offs) resulting from our home retention efforts, as well as new laws enacted in a number of states that
lengthen the time required to complete a foreclosure. Our credit losses totaled $13.6 billion in 2009, compared
with credit losses of $6.5 billion in 2008. Our credit-related expenses, which consist of our provision for credit
losses and our foreclosed property expense, are included in our consolidated statement of operations. Our
credit losses, by contrast, are not defined within GAAP and may not be calculated in the same manner as
similarly titled measures reported by other companies. We measure our credit losses as our charge-offs, net of
recoveries plus our foreclosed property expense, adjusted to eliminate the impact associated with our
HomeSaver Advance loans and our acquisition of credit-impaired loans from MBS trusts, in the manner
described in “MD&A—Consolidated Results of Operations—Credit-Related Expenses—Credit Loss
Performance Metrics.”
Although our combined loss reserves increased significantly in 2009 compared with 2008, we did not add to
our combined loss reserves in the fourth quarter of 2009. The slight decline in our loss reserves as of
December 31, 2009 compared with September 30, 2009 was due to a moderation in the pace at which loans
transitioned to seriously delinquent status and an improvement in our loss severities due to stabilizing home
prices as well as an increase in the number of loans acquired from our MBS trusts in order to complete
workouts for the loans. To the extent that the acquisition cost of these loans exceeded the estimated fair value,
we recorded a fair value loss charge-off against the “Reserve for guaranty losses.” Recognizing these fair
value losses, which typically meet or exceed the actual credit losses we ultimately realize, has the effect of
reducing the inherent losses that remain in our guaranty book of business, and consequently reduces our
11