Fannie Mae 2009 Annual Report Download - page 15
Download and view the complete annual report
Please find page 15 of the 2009 Fannie Mae annual report below. You can navigate through the pages in the report by either clicking on the pages listed below, or by using the keyword search tool below to find specific information within the annual report.-
 1
1 -
2
-
3
-
4
-
 5
5 -
 6
6 -
 7
7 -
 8
8 -
 9
9 -
 10
10 -
 11
11 -
 12
12 -
 13
13 -
 14
14 -
 15
15 -
 16
16 -
 17
17 -
 18
18 -
 19
19 -
 20
20 -
 21
21 -
 22
22 -
 23
23 -
 24
24 -
 25
25 -
26
-
27
-
28
-
29
-
30
-
31
-
32
-
33
-
34
-
35
-
36
-
37
-
38
-
39
-
40
-
41
-
42
-
43
-
44
-
45
-
46
-
47
-
48
-
49
-
50
-
51
-
52
-
53
-
54
-
55
-
56
-
57
-
58
-
59
-
60
-
61
-
62
-
63
-
64
-
65
-
66
-
67
-
68
-
69
-
70
-
71
-
72
-
73
-
74
-
75
-
76
-
77
-
78
-
79
-
80
-
81
-
82
-
83
-
84
-
85
-
86
-
87
-
88
-
89
-
90
-
91
-
92
-
93
-
94
-
95
-
96
-
97
-
98
-
99
-
100
-
101
-
102
-
103
-
104
-
105
-
106
-
107
-
108
-
109
-
110
-
111
-
112
-
113
-
114
-
115
-
116
-
117
-
118
-
119
-
120
-
121
-
122
-
123
-
124
-
125
-
126
-
127
-
128
-
129
-
130
-
131
-
132
-
133
-
134
-
135
-
136
-
137
-
138
-
139
-
140
-
141
-
142
-
143
-
144
-
145
-
146
-
147
-
148
-
149
-
150
-
151
-
152
-
153
-
154
-
155
-
156
-
157
-
158
-
159
-
160
-
161
-
162
-
163
-
164
-
165
-
166
-
167
-
168
-
169
-
170
-
171
-
172
-
173
-
174
-
175
-
176
-
177
-
178
-
179
-
180
-
181
-
182
-
183
-
184
-
185
-
186
-
187
-
188
-
189
-
190
-
191
-
192
-
193
-
194
-
195
-
196
-
197
-
198
-
199
-
200
-
201
-
202
-
203
-
204
-
205
-
206
-
207
-
208
-
209
-
210
-
211
-
212
-
213
-
214
-
215
-
216
-
217
-
218
-
219
-
220
-
221
-
222
-
223
-
224
-
225
-
226
-
227
-
228
-
229
-
230
-
231
-
232
-
233
-
234
-
235
-
236
-
237
-
238
-
239
-
240
-
241
-
242
-
243
-
244
-
245
-
246
-
247
-
248
-
249
-
250
-
251
-
252
-
253
-
254
-
255
-
256
-
257
-
258
-
259
-
260
-
261
-
262
-
263
-
264
-
265
-
266
-
267
-
268
-
269
-
270
-
271
-
272
-
273
-
274
-
275
-
276
-
277
-
278
-
279
-
280
-
281
-
282
-
283
-
284
-
285
-
286
-
287
-
288
-
289
-
290
-
291
-
292
-
293
-
294
-
295
-
296
-
297
-
298
-
299
-
300
-
301
-
302
-
303
-
304
-
305
-
306
-
307
-
308
-
309
-
310
-
311
-
312
-
313
-
314
-
315
-
316
-
317
-
318
-
319
-
320
-
321
-
322
-
323
-
324
-
325
-
326
-
327
-
328
-
329
-
330
-
331
-
332
-
333
-
334
-
335
-
336
-
337
-
338
-
339
-
340
-
341
-
342
-
343
-
344
-
345
-
346
-
347
-
348
-
349
-
350
-
351
-
352
-
353
-
354
-
355
-
356
-
357
-
358
-
359
-
360
-
361
-
362
-
363
-
364
-
365
-
366
-
367
-
368
-
369
-
370
-
371
-
372
-
373
-
374
-
375
-
376
-
377
-
378
-
379
-
380
-
381
-
382
-
383
-
384
-
385
-
386
-
387
-
388
-
389
-
390
-
391
-
392
-
393
-
394
-
395
 |
 |

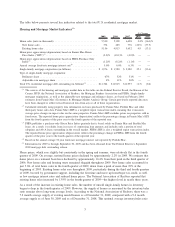
Table 1: Credit Statistics, Single-Family Guaranty Book of Business
(1)
Full
Year Q4 Q3 Q2 Q1
Full
Year
2009 2008
(Dollars in millions)
As of the end of each period:
Serious delinquency rate
(2)
. . . . . . . . . . . . . 5.38% 5.38% 4.72% 3.94% 3.15% 2.42%
Nonperforming loans
(3)
. . . . . . . . . . . . . . . . $215,505 $215,505 $197,415 $170,483 $144,523 $118,912
Foreclosed property inventory
(number of properties) . . . . . . . . . . . . . . 86,155 86,155 72,275 62,615 62,371 63,538
Combined loss reserves
(4)
. . . . . . . . . . . . . . $ 62,848 $ 62,848 $ 64,724 $ 54,152 $ 41,082 $ 24,649
During the period:
Foreclosed property acquisitions (number of
properties)
(5)
. . . . . . . . . . . . . . . . . . . . . 145,617 47,189 40,959 32,095 25,374 94,652
Single-family credit-related expenses
(6)
. . . . . $ 71,320 $ 10,943 $ 21,656 $ 18,391 $ 20,330 $ 29,725
Single-family credit losses
(7)
. . . . . . . . . . . . $ 13,362 $ 3,976 $ 3,620 $ 3,301 $ 2,465 $ 6,467
Loan workout activity (number of loans):
Total home retention loan workouts
(8)
. . . . . 160,722 49,871 37,431 33,098 40,322 112,247
Preforeclosure sales and deeds-in-lieu of
foreclosure. . . . . . . . . . . . . . . . . . . . . . . 39,617 13,459 11,827 8,360 5,971 11,696
Total loan workouts . . . . . . . . . . . . . . . . . . 200,339 63,330 49,258 41,458 46,293 123,943
Total loan workouts as a percentage of
delinquent loans in our single-family
guaranty book of business
(9)
. . . . . . . . . . 12.24% 15.48% 12.98% 12.42% 16.12% 11.32%
(1)
Our single-family guaranty book of business consists of (a) single-family mortgage loans held in our mortgage
portfolio, (b) single-family Fannie Mae MBS held in our mortgage portfolio, (c) single-family Fannie Mae MBS held
by third parties, and (d) other credit enhancements that we provide on single-family mortgage assets, such as long
term-standby commitments. It excludes non-Fannie Mae mortgage-related securities held in our investment portfolio
for which we do not provide a guaranty.
(2)
Calculated based on the number of conventional single-family loans that are three or more months past due and loans
that have been referred to foreclosure but not yet foreclosed upon, divided by the number of loans in our
conventional single-family guaranty book of business. We include all of the conventional single-family loans that we
own and those that back Fannie Mae MBS in the calculation of the single-family serious delinquency rate.
(3)
Represents the total amount of nonperforming loans, including troubled debt restructurings and HomeSaver Advance
first-lien loans that are on accrual status. A troubled debt restructuring is a restructuring of a mortgage loan in which
a concession is granted to a borrower experiencing financial difficulty. We generally classify loans as nonperforming
when the payment of principal or interest on the loan is two months or more past due.
(4)
Consists of the allowance for loan losses for loans held for investment in our mortgage portfolio and the reserve for
guaranty losses related to both single-family loans backing Fannie Mae MBS and single-family loans that we have
guaranteed under long-term standby commitments.
(5)
Includes acquisitions through deeds-in-lieu of foreclosure.
(6)
Consists of the provision for credit losses and foreclosed property expense.
(7)
Consists of (a) charge-offs, net of recoveries and (b) foreclosed property expense; adjusted to exclude the impact of
fair value losses resulting from credit-impaired loans acquired from MBS trusts and HomeSaver Advance loans.
(8)
Consists of (a) modifications, which do not include trial modifications under the Home Affordable Modification
Program, as well as repayment plans and forbearances that have been initiated but not completed; (b) repayment
plans and forbearances completed and (c) HomeSaver Advance first-lien loans. See “Table 46: Statistics on Single-
Family Loan Workouts” in “MD&A—Risk Management—Credit Risk Management” for additional information on
our various types of loan workouts.
(9)
Calculated based on annualized problem loan workouts during the period as a percentage of delinquent loans in our
single-family guaranty book of business as of the end of the period.
10