Epson 2004 Annual Report Download - page 71
Download and view the complete annual report
Please find page 71 of the 2004 Epson annual report below. You can navigate through the pages in the report by either clicking on the pages listed below, or by using the keyword search tool below to find specific information within the annual report.-
 1
1 -
2
-
3
-
4
-
5
-
6
-
7
-
8
-
9
-
10
-
11
-
12
-
13
-
14
-
15
-
16
-
17
-
18
-
19
-
20
-
21
-
22
-
23
-
24
-
25
-
26
-
27
-
28
-
29
-
30
-
31
-
32
-
33
-
34
-
35
-
36
-
37
-
38
-
39
-
40
-
41
-
42
-
43
-
44
-
45
-
46
-
47
-
48
-
49
-
50
-
51
-
52
-
53
-
54
-
55
-
56
-
57
-
58
-
59
-
60
-
 61
61 -
 62
62 -
 63
63 -
 64
64 -
 65
65 -
 66
66 -
 67
67 -
 68
68 -
 69
69 -
 70
70 -
 71
71 -
 72
72 -
 73
73 -
 74
74 -
 75
75 -
 76
76
 |
 |

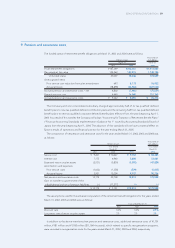
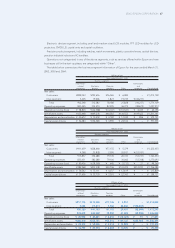
69SEIKO EPSON CORPORATION
Millions of yen
Year ended March 31, 2003
Geographic region
Eliminations
The Asia/ and
Japan Americas Europe Oceania corporate Consolidated
Net sales:
Customers ¥ 637,544 ¥230,263 ¥258,278 ¥196,368 – ¥1,322,453
Inter-segment 478,441 39,315 5,573 439,632 ¥(962,961) –
Total 1,115,985 269,578 263,851 636,000 (962,961) 1,322,453
Operating expenses 1,097,056 262,468 260,665 620,376 (967,472) 1,273,093
Operating income ¥ 18,929 ¥ 7,110 ¥ 3,186 ¥ 15,624 ¥ 4,511 ¥ 49,360
Identifiable assets ¥ 785,754 ¥ 83,814 ¥ 73,667 ¥204,989 ¥ 47,856 ¥1,196,080
Millions of yen
Year ended March 31, 2004
Geographic region
Eliminations
The Asia/ and
Japan Americas Europe Oceania corporate Consolidated
Net sales:
Customers ¥ 686,553 ¥224,683 ¥297,772 ¥204,235 – ¥1,413,243
Inter-segment 491,089 42,320 2,497 478,878 ¥(1,014,784) –
Total 1,177,642 267,003 300,269 683,113 (1,014,784) 1,413,243
Operating expenses 1,141,043 255,937 290,719 664,517 (1,016,374) 1,335,842
Operating income ¥ 36,599 ¥ 11,066 ¥ 9,550 ¥ 18,596 ¥ 1,590 ¥ 77,401
Identifiable assets ¥ 758,593 ¥ 74,024 ¥ 73,820 ¥193,401 ¥ 106,653 ¥1,206,491
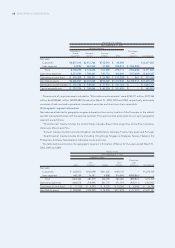
Thousands of U.S. dollars
Year ended March 31, 2004
Geographic region
Eliminations
The Asia/ and
Japan Americas Europe Oceania corporate Consolidated
Net sales:
Customers $ 6,495,913 $2,125,868 $2,817,409 $1,932,397 – $13,371,587
Inter-segment 4,646,504 400,416 23,626 4,530,968 $(9,601,514) –
Total 11,142,417 2,526,284 2,841,035 6,463,365 (9,601,514) 13,371,587
Operating expenses 10,796,130 2,421,582 2,750,677 6,287,416 (9,616,558) 12,639,247
Operating income $ 346,287 $ 104,702 $ 90,358 $ 175,949 $ 15,044 $ 732,340
Identifiable assets $ 7,177,529 $ 700,388 $ 698,458 $1,829,889 $ 1,009,111 $11,415,375
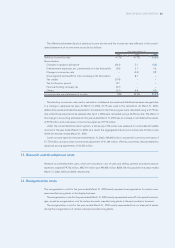
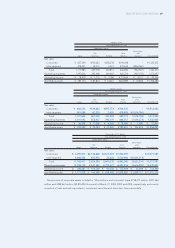
The amounts of corporate assets included in “Eliminations and corporate” were ¥158,417 million, ¥227,464
million and ¥299,661 million ($2,835,282 thousand) at March 31, 2002, 2003 and 2004, respectively, and mainly
consisted of cash and cash equivalents, investment securities and short-term loans receivable.