Epson 2004 Annual Report Download - page 69
Download and view the complete annual report
Please find page 69 of the 2004 Epson annual report below. You can navigate through the pages in the report by either clicking on the pages listed below, or by using the keyword search tool below to find specific information within the annual report.-
 1
1 -
2
-
3
-
4
-
5
-
6
-
7
-
8
-
9
-
10
-
11
-
12
-
13
-
14
-
15
-
16
-
17
-
18
-
19
-
20
-
21
-
22
-
23
-
24
-
25
-
26
-
27
-
28
-
29
-
30
-
31
-
32
-
33
-
34
-
35
-
36
-
37
-
38
-
39
-
40
-
41
-
42
-
43
-
44
-
45
-
46
-
47
-
48
-
49
-
50
-
51
-
52
-
53
-
54
-
55
-
56
-
57
-
58
-
 59
59 -
 60
60 -
 61
61 -
 62
62 -
 63
63 -
 64
64 -
 65
65 -
 66
66 -
 67
67 -
 68
68 -
 69
69 -
 70
70 -
 71
71 -
 72
72 -
 73
73 -
 74
74 -
 75
75 -
 76
76
 |
 |

67SEIKO EPSON CORPORATION
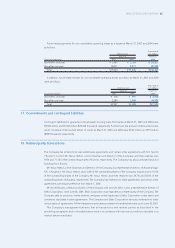
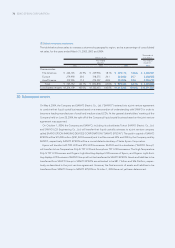
Electronic devices segment, including small and medium-sized LCD modules, TFT LCD modules for LCD
projectors, CMOS LSI, crystal units and crystal oscillators.
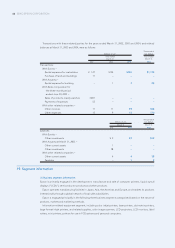
Precision products segment, including watches, watch movements, plastic corrective lenses, optical devices,
precision industrial robots and IC handlers.
Operations not categorized in any of the above segments, such as services offered within Epson and new
businesses still in the start-up phase, are categorized within “Other”.
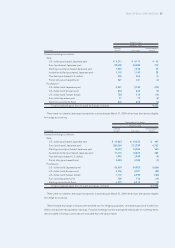
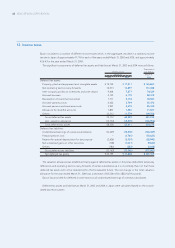
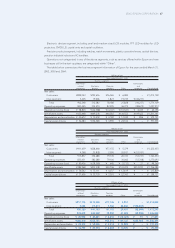
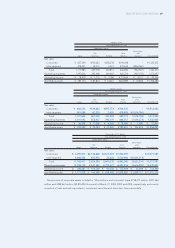
The table below summarizes the business segment information of Epson for the years ended March 31,
2002, 2003 and 2004:
Millions of yen
Year ended March 31, 2002
Business segment
Information- Eliminations
related Electronic Precision and
equipment devices products Other corporate Consolidated
Net sales:
Customers ¥899,043 ¥292,616 ¥76,365 ¥ 6,085 – ¥1,274,109
Inter-segment 3,205 19,466 1,823 19,743 ¥ (44,237) –
Total 902,248 312,082 78,188 25,828 (44,237) 1,274,109
Operating expenses 843,445 334,470 82,295 36,375 (48,672) 1,247,913
Operating income (loss) ¥ 58,803 ¥ (22,388) ¥ (4,107) ¥ (10,547) ¥ 4,435 ¥ 26,196
Identifiable assets ¥425,668 ¥469,236 ¥60,283 ¥136,552 ¥149,422 ¥1,241,161
Depreciation and amortization ¥ 40,672 ¥ 70,459 ¥ 4,182 ¥ 12,942 ¥ 896 ¥ 129,151
Capital expenditures ¥ 32,683 ¥136,348 ¥ 3,990 ¥ 24,512 ¥ – ¥ 197,533
Millions of yen
Year ended March 31, 2003
Business segment
Information- Eliminations
related Electronic Precision and
equipment devices products Other corporate Consolidated
Net sales:
Customers ¥911,459 ¥328,460 ¥77,155 ¥ 5,379 – ¥1,322,453
Inter-segment 4,398 25,828 2,590 20,931 ¥ (53,747) –
Total 915,857 354,288 79,745 26,310 (53,747) 1,322,453
Operating expenses 835,431 382,288 79,100 30,042 (53,768) 1,273,093
Operating income (loss) ¥ 80,426 ¥ (28,000) ¥ 645 ¥ (3,732) ¥ 21 ¥ 49,360
Identifiable assets ¥384,968 ¥402,248 ¥50,706 ¥143,225 ¥214,933 ¥1,196,080
Depreciation and amortization ¥ 34,042 ¥ 75,111 ¥ 4,037 ¥ 12,619 ¥ – ¥ 125,809
Capital expenditures ¥ 27,656 ¥ 35,720 ¥ 3,393 ¥ 22,342 ¥ – ¥ 89,111
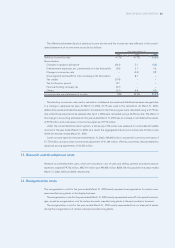
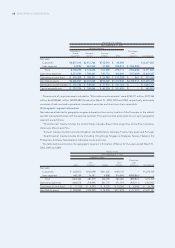
Millions of yen
Year ended March 31, 2004
Business segment
Information- Eliminations
related Electronic Precision and
equipment devices products Other corporate Consolidated
Net sales:
Customers ¥917,116 ¥413,540 ¥77,736 ¥ 4,851 – ¥1,413,243
Inter-segment 3,264 27,613 3,366 24,606 ¥ (58,849) –
Total 920,380 441,153 81,102 29,457 (58,849) 1,413,243
Operating expenses 874,478 400,532 78,292 41,480 (58,940) 1,335,842
Operating income (loss) ¥ 45,902 ¥ 40,621 ¥ 2,810 ¥ (12,023) ¥ 91 ¥ 77,401
Identifiable assets ¥366,410 ¥352,755 ¥52,216 ¥149,122 ¥285,988 ¥1,206,491
Depreciation and amortization ¥ 33,312 ¥ 58,006 ¥ 4,013 ¥ 14,983 ¥ – ¥ 110,314
Capital expenditures ¥ 34,797 ¥ 20,574 ¥ 4,283 ¥ 10,725 ¥ – ¥ 70,379