Electrolux 2013 Annual Report Download - page 8
Download and view the complete annual report
Please find page 8 of the 2013 Electrolux annual report below. You can navigate through the pages in the report by either clicking on the pages listed below, or by using the keyword search tool below to find specific information within the annual report.-
 1
1 -
 2
2 -
 3
3 -
 4
4 -
 5
5 -
 6
6 -
 7
7 -
 8
8 -
 9
9 -
 10
10 -
 11
11 -
 12
12 -
 13
13 -
 14
14 -
 15
15 -
 16
16 -
 17
17 -
 18
18 -
 19
19 -
20
-
21
-
22
-
23
-
24
-
25
-
26
-
27
-
28
-
29
-
30
-
31
-
32
-
33
-
34
-
35
-
36
-
37
-
38
-
39
-
40
-
41
-
42
-
43
-
44
-
45
-
46
-
47
-
48
-
49
-
50
-
51
-
52
-
53
-
54
-
55
-
56
-
57
-
58
-
59
-
60
-
61
-
62
-
63
-
64
-
65
-
66
-
67
-
68
-
69
-
70
-
71
-
72
-
73
-
74
-
75
-
76
-
77
-
78
-
79
-
80
-
81
-
82
-
83
-
84
-
85
-
86
-
87
-
88
-
89
-
90
-
91
-
92
-
93
-
94
-
95
-
96
-
97
-
98
-
99
-
100
-
101
-
102
-
103
-
104
-
105
-
106
-
107
-
108
-
109
-
110
-
111
-
112
-
113
-
114
-
115
-
116
-
117
-
118
-
119
-
120
-
121
-
122
-
123
-
124
-
125
-
126
-
127
-
128
-
129
-
130
-
131
-
132
-
133
-
134
-
135
-
136
-
137
-
138
-
139
-
140
-
141
-
142
-
143
-
144
-
145
-
146
-
147
-
148
-
149
-
150
-
151
-
152
-
153
-
154
-
155
-
156
-
157
-
158
-
159
-
160
-
161
-
162
-
163
-
164
-
165
-
166
-
167
-
168
-
169
-
170
-
171
-
172
 |
 |

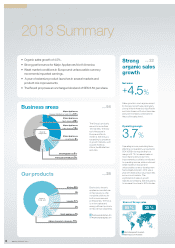
2013 Summary
• Organic sales growth of 4.5%.
• Strong performance for Major Appliances North America.
• Weak market conditions in Europe and unfavourable currency
movements impacted earnings.
• A year of extensive product launches in several markets and
product mix improvements.
• The Board proposes an unchanged dividend of SEK6.50 per share.
page 54
page 28
page 22
Strong
organic sales
growth
Net sales
+4.5%
Sales growth in most regions except
for Europe. Growth was particularly
strong in North America, Asia/Pacific
and Latin America. Product launches
and price increases contributed to
the positive sales trend.
Operating margin
3.7%
Operating income, excluding items
affecting comparability, amounted to
SEK4,055m corresponding to a
margin of 3.7%. Increased sales in
most regions and product-mix
improvements positively contributed
to operating income, while continued
weak markets in Europe and
unfavourable currency development
had a negative impact. 2013 was a
year with extensive product launches
across most markets. The
significance of sales in growth
markets is increasing. Electrolux aims
to increase this share to 50% of sales.
35%65%
Our products
Electrolux is the only
appliance manufacturer
in the industry to offer
complete solutions for
both consumers and
professionals. The focus
is on innovative and
energy- efficient products
in the premium segments.
Share of
Group sales
Kitchen 60%
3%
2%
Laundry 17%
Small appliances 8%
Adjacent product categories 10%
Business areas
The Group’s products
are sold in more than
150 markets. The larg-
est of these are in
Europe and North
America. Electrolux is
expanding its presence
in growth markets, such
as Latin America,
Africa, the Middle East
and Asia.
Share of
Group sales
Major Appliances
Europe, Middle East and Africa 31%
Major Appliances
North America 29%
Major Appliances
Latin America 19%
Major Appliances
Asia/Pacific 8%
Small Appliances 8%
Professional Products 5%
Proffessional kitchen, 3%
Proffessional laundry, 2%
Electrolux growth markets
Electrolux core markets
Share of Group sales
6ANNUAL REPORT 2013
Vision and mission