Dish Network 2009 Annual Report Download - page 95
Download and view the complete annual report
Please find page 95 of the 2009 Dish Network annual report below. You can navigate through the pages in the report by either clicking on the pages listed below, or by using the keyword search tool below to find specific information within the annual report.-
 1
1 -
2
-
3
-
4
-
5
-
6
-
7
-
8
-
9
-
10
-
11
-
12
-
13
-
14
-
15
-
16
-
17
-
18
-
19
-
20
-
21
-
22
-
23
-
24
-
25
-
26
-
27
-
28
-
29
-
30
-
31
-
32
-
33
-
34
-
35
-
36
-
37
-
38
-
39
-
40
-
41
-
42
-
43
-
44
-
45
-
46
-
47
-
48
-
49
-
50
-
51
-
52
-
53
-
54
-
55
-
56
-
57
-
58
-
59
-
60
-
61
-
62
-
63
-
64
-
65
-
66
-
67
-
68
-
69
-
70
-
71
-
72
-
73
-
74
-
75
-
76
-
77
-
78
-
79
-
80
-
81
-
82
-
83
-
84
-
 85
85 -
 86
86 -
 87
87 -
 88
88 -
 89
89 -
 90
90 -
 91
91 -
 92
92 -
 93
93 -
 94
94 -
 95
95 -
 96
96 -
 97
97 -
 98
98 -
 99
99 -
 100
100 -
 101
101 -
 102
102 -
 103
103 -
 104
104 -
 105
105 -
106
-
107
-
108
-
109
-
110
-
111
-
112
-
113
-
114
-
115
-
116
-
117
-
118
-
119
-
120
-
121
-
122
-
123
-
124
-
125
-
126
-
127
-
128
-
129
-
130
-
131
-
132
-
133
-
134
-
135
-
136
-
137
-
138
-
139
-
140
-
141
-
142
-
143
-
144
-
145
-
146
-
147
-
148
-
149
-
150
-
151
-
152
 |
 |

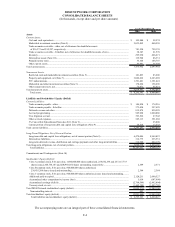
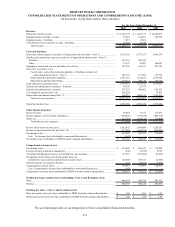
DISH NETWORK CORPORATION
CONSOLIDATED STATEMENTS OF OPERATIONS AND COMPREHENSIVE INCOME (LOSS)
(In thousands, except share and per share amounts)
The accompanying notes are an integral part of these consolidated financial statements.
F-5
2009 2008 2007
Revenue:
Subscriber-related revenue........................................................................................................... 11,538,729$ 11,455,575$ 10,690,976$
Equipment sales and other revenue............................................................................................... 97,863 124,261 399,399
Equipment sales - EchoStar.......................................................................................................... 7,457 11,601 -
Transitional services and other revenue - EchoStar...................................................................... 20,102 25,750 -
Total revenue......................................................................................................................... 11,664,151 11,617,187 11,090,375
Costs and Expenses:
Subscriber-related expenses (exclusive of depreciation shown below - Note 7).......................... 6,359,329 5,977,355 5,496,579
Satellite and transmission expenses (exclusive of depreciation shown below - Note 7):
EchoStar................................................................................................................................... 319,752 305,322 -
Other......................................................................................................................................... 33,672 32,407 180,687
Equipment, transitional services and other cost of sales............................................................... 121,238 169,917 281,722
Subscriber acquisition costs:
Cost of sales - subscriber promotion subsidies - EchoStar (exclusive of
depreciation shown below - Note 7)................................................................................. 188,793 167,508 123,730
Other subscriber promotion subsidies.................................................................................... 1,071,655 1,124,103 1,219,943
Subscriber acquisition advertising......................................................................................... 279,114 240,130 226,742
Total subscriber acquisition costs................................................................................................. 1,539,562 1,531,741 1,570,415
General and administrative expenses - EchoStar.......................................................................... 45,356 53,373 -
General and administrative expenses............................................................................................ 557,255 490,662 624,251
Tivo litigation expense (Note 14)................................................................................................. 361,024 - 33,907
Depreciation and amortization (Note 7)....................................................................................... 940,033 1,000,230 1,329,410
Total costs and expenses........................................................................................................ 10,277,221 9,561,007 9,516,971
Operating income (loss)................................................................................................................ 1,386,930 2,056,180 1,573,404
Other Income (Expense):
Interest income............................................................................................................................. 30,034 51,217 137,872
Interest expense, net of amounts capitalized................................................................................. (388,425)
(369,878) (405,319)
Other, net...................................................................................................................................... (15,707) (168,713) (55,804)
Total other income (expense)................................................................................................ (374,098) (487,374) (323,251)
Income (loss) before income taxes............................................................................................... 1,012,832 1,568,806 1,250,153
Income tax (provision) benefit, net (Note 10)............................................................................... (377,429) (665,859) (494,099)
Net income (loss).......................................................................................................................... 635,403 902,947 756,054
Less: Net income (loss) attributable to noncontrolling interest............................................... (142) - -
Net income (loss) attributable to DISH Network common shareholders...................................... 635,545$ 902,947$ 756,054$
Comprehensive Income (Loss):
Net income (loss).......................................................................................................................... 635,403$ 902,947$ 756,054$
Foreign currency translation adjustments..................................................................................... (106) (3,278) 8,793
Unrealized holding gains (losses) on available-for-sale securities................................................ 133,635 (291,664) (12,655)
Recognition of previously unrealized (gains) losses on
available-for-sale securities included in net income (loss)......................................................... (20,045) 189,513 (4,944)
Deferred income tax (expense) benefit......................................................................................... 128 (10,017) 5,630
Comprehensive income (loss)....................................................................................................... 749,015 787,501 752,878
Less: Comprehensive income (loss) attributable to noncontrolling interest.............................. (142) - -
Comprehensive income (loss) attributable to DISH Network common shareholders................... 749,157$ 787,501$ 752,878$
Weighted-average common shares outstanding - Class A and B common stock:
Basic............................................................................................................................................. 446,874 448,786 447,302
Diluted.......................................................................................................................................... 448,596 460,226 456,834
Earnings per share - Class A and B common stock:
Basic net income (loss) per share attributable to DISH Network common shareholders.............. 1.42$ 2.01$ 1.69$
Diluted net income (loss) per share attributable to DISH Network common shareholders........... 1.42
$ 1.98$ 1.68$
For the Years Ended December 31,