Dish Network 2009 Annual Report Download - page 140
Download and view the complete annual report
Please find page 140 of the 2009 Dish Network annual report below. You can navigate through the pages in the report by either clicking on the pages listed below, or by using the keyword search tool below to find specific information within the annual report.-
 1
1 -
2
-
3
-
4
-
5
-
6
-
7
-
8
-
9
-
10
-
11
-
12
-
13
-
14
-
15
-
16
-
17
-
18
-
19
-
20
-
21
-
22
-
23
-
24
-
25
-
26
-
27
-
28
-
29
-
30
-
31
-
32
-
33
-
34
-
35
-
36
-
37
-
38
-
39
-
40
-
41
-
42
-
43
-
44
-
45
-
46
-
47
-
48
-
49
-
50
-
51
-
52
-
53
-
54
-
55
-
56
-
57
-
58
-
59
-
60
-
61
-
62
-
63
-
64
-
65
-
66
-
67
-
68
-
69
-
70
-
71
-
72
-
73
-
74
-
75
-
76
-
77
-
78
-
79
-
80
-
81
-
82
-
83
-
84
-
85
-
86
-
87
-
88
-
89
-
90
-
91
-
92
-
93
-
94
-
95
-
96
-
97
-
98
-
99
-
100
-
101
-
102
-
103
-
104
-
105
-
106
-
107
-
108
-
109
-
110
-
111
-
112
-
113
-
114
-
115
-
116
-
117
-
118
-
119
-
120
-
121
-
122
-
123
-
124
-
125
-
126
-
127
-
128
-
129
-
 130
130 -
 131
131 -
 132
132 -
 133
133 -
 134
134 -
 135
135 -
 136
136 -
 137
137 -
 138
138 -
 139
139 -
 140
140 -
 141
141 -
 142
142 -
 143
143 -
 144
144 -
 145
145 -
 146
146 -
 147
147 -
 148
148 -
 149
149 -
 150
150 -
151
-
152
 |
 |

DISH NETWORK CORPORATION
NOTES TO CONSOLIDATED FINANCIAL STATEMENTS - Continued
F-50
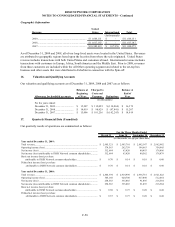
Geographic Information
United
Revenue States International Total
2009............................................................................. 11,664,151$ -$ 11,664,151$
2008............................................................................. 11,617,187$ -$ 11,617,187$
2007............................................................................. 10,982,419$ 107,956$ 11,090,375$
(In thous ands)
As of December 31, 2009 and 2008, all of our long-lived assets were located in the United States. Revenues
are attributed to geographic regions based upon the location from where the sale originated. United States
revenue includes transactions with both United States and customers abroad. International revenue includes
transactions with customers in Europe, Africa, South America and the Middle East. Prior to 2008, revenues
from these customers are included within the All Other operating segment and related to the set-top box
business and other assets that were distributed to EchoStar in connection with the Spin-off.
16. Valuation and Qualifying Accounts
Our valuation and qualifying accounts as of December 31, 2009, 2008 and 2007 are as follows:
Allowance for doubtful accounts
Balance at
Beginnin g
of Year
Charged to
Costs and
Expenses Deductions
Balance at
End of
Year
For the years ended:
December 31, 2009............................ 15,207$ 112,025$ (110,860)$ 16 ,372$
December 31, 2008............................ 14,019$ 98,629$ (97,441)$ 15,207$
December 31, 2007............................ 15,006$ 101,256$ (102,243)$ 14 ,019$
(In thousands)
17. Quarterly Financial Data (Unaudited)
Our quarterly results of operations are summarized as follows:
March 31 June 30 Septem ber 30 December 31
Year ended December 31, 2009:
Total revenue...................................................................................................... 2,905,321$ 2,903,701$ 2,892,147$ 2,962,982$
Operating income (loss)..................................................................................... 574,563 262,759 194,663 354,945
Net income (loss) ............................................................................................... 312,684 63,420 80,493 178,806
Net income (loss) attributable to DISH Network common shareholders............ 312,684 63,420 80,562 178,879
Basic net income (loss) per share
attributable to DISH Network common shareholders.................................. 0.70$ 0.14$ 0.18$ 0.40$
Diluted net income (loss) per share
attributable to DISH Network common shareholders................................. 0.70$ 0.14$ 0.18$ 0.40$
Year ended December 31, 2008:
Total revenue ..................................................................................................... 2,844,394$ 2,914,990$ 2,936,781$ 2,921,022$
Operating income (loss)..................................................................................... 505,168 620,708 417,840 512,464
Net income (loss) ............................................................................................... 258,583 335,885 91,895 216,584
Net income (loss) attributable to DISH Network common shareholders............ 258,583 335,885 91,895 216,584
Basic net income (loss) per share
attributable to DISH Network common shareholders.................................. 0.58$ 0.75$ 0.20$ 0.48$
Diluted net income
(
loss
)
p
er share
attributable to DISH Network common shareholders................................. 0.57$ 0.73$ 0.20$ 0.48$
(In thousands, except per share data)
For the Three Months Ended