Dish Network 2009 Annual Report Download - page 107
Download and view the complete annual report
Please find page 107 of the 2009 Dish Network annual report below. You can navigate through the pages in the report by either clicking on the pages listed below, or by using the keyword search tool below to find specific information within the annual report.-
 1
1 -
2
-
3
-
4
-
5
-
6
-
7
-
8
-
9
-
10
-
11
-
12
-
13
-
14
-
15
-
16
-
17
-
18
-
19
-
20
-
21
-
22
-
23
-
24
-
25
-
26
-
27
-
28
-
29
-
30
-
31
-
32
-
33
-
34
-
35
-
36
-
37
-
38
-
39
-
40
-
41
-
42
-
43
-
44
-
45
-
46
-
47
-
48
-
49
-
50
-
51
-
52
-
53
-
54
-
55
-
56
-
57
-
58
-
59
-
60
-
61
-
62
-
63
-
64
-
65
-
66
-
67
-
68
-
69
-
70
-
71
-
72
-
73
-
74
-
75
-
76
-
77
-
78
-
79
-
80
-
81
-
82
-
83
-
84
-
85
-
86
-
87
-
88
-
89
-
90
-
91
-
92
-
93
-
94
-
95
-
96
-
 97
97 -
 98
98 -
 99
99 -
 100
100 -
 101
101 -
 102
102 -
 103
103 -
 104
104 -
 105
105 -
 106
106 -
 107
107 -
 108
108 -
 109
109 -
 110
110 -
 111
111 -
 112
112 -
 113
113 -
 114
114 -
 115
115 -
 116
116 -
 117
117 -
118
-
119
-
120
-
121
-
122
-
123
-
124
-
125
-
126
-
127
-
128
-
129
-
130
-
131
-
132
-
133
-
134
-
135
-
136
-
137
-
138
-
139
-
140
-
141
-
142
-
143
-
144
-
145
-
146
-
147
-
148
-
149
-
150
-
151
-
152
 |
 |

DISH NETWORK CORPORATION
NOTES TO CONSOLIDATED FINANCIAL STATEMENTS - Continued
F-17
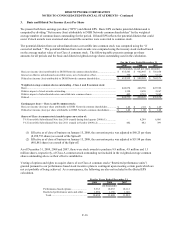
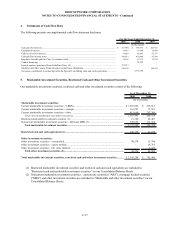
4. Statements of Cash Flow Data
The following presents our supplemental cash flow statement disclosure.
2009 2008 20 07
Cash paid for interest............................................................................................................................. $ 357,990 $ 385,9 36 $ 405,915
Capitalized interest................................................................................................................................ 1 9,68 5 16,8 80 18,088
Cash received for interest...................................................................................................................... 1 9,48 9 44,8 43 97,575
Cash paid for income taxes.................................................................................................................... 348,931 4 30,408 87,994
Employee benefits paid in Class A common stock................................................................................ 1 2,19 8 19,3 75 17,674
Vendor financing .................................................................................................................................. - 24,469 -
Launch contract purchased from EchoStar (Note 18)............................................................................ 102,913 - -
Satellites and other assets financed under capital lease obligations....................................................... 14 0,109 - 198,219
Net assets contributed in connection with the Spin-off, excluding cash and cash equivalents............... - 2,765,398 -
For the Years Ended December 31,
(In thousands)
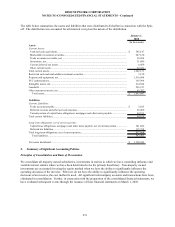
5. Marketable Investment Securities, Restricted Cash and Other Investment Securities
Our marketable investment securities, restricted cash and other investment securities consist of the following:
As of December 31,
2009 2008
(In tho us and s)
Marketable investment securities:
Current marketable investment securities - VRDNs ........................................................................... 1,053,826$ 239,611$
Current marketable investment securities - strategic........................................................................... 163,997 13,561
Current marketable investment securities - other ................................................................................ 815,669 207,386
Total current marketable investment securities.............................................................................2,033,492 460,558
Restricted marketable investment securities (1).................................................................................. 21,360 22,407
Noncurrent marketable investment securities - ARS and MBS (2)..................................................... 120,650 113,394
Total marketable investment securities...................................................................................... 2,175,502 596,359
Restricted cash and cash equivalents (1)......................................................................................... 120,133 61,199
Other investment securities:
Other investment securities - cost method........................................................................................... 49,574 15,794
Other investment securities - equity method........................................................................................ - 26,785
Other investment securities - fair value method................................................................................... - 2,323
Total other investment securities (2)........................................................................................... 49,574 44,902
Total marketable investment securities, restricted cash and other investment securities........... 2,345,209$ 702,460$
(1) Restricted marketable investment securities and restricted cash and cash equivalents are included in
“Restricted cash and marketable investment securities” on our Consolidated Balance Sheets.
(2) Noncurrent marketable investment securities – auction rate securities (“ARS”), mortgage backed securities
(“MBS”) and other investment securities are included in “Marketable and other investment securities” on our
Consolidated Balance Sheets.