Dish Network 2009 Annual Report Download - page 69
Download and view the complete annual report
Please find page 69 of the 2009 Dish Network annual report below. You can navigate through the pages in the report by either clicking on the pages listed below, or by using the keyword search tool below to find specific information within the annual report.-
 1
1 -
2
-
3
-
4
-
5
-
6
-
7
-
8
-
9
-
10
-
11
-
12
-
13
-
14
-
15
-
16
-
17
-
18
-
19
-
20
-
21
-
22
-
23
-
24
-
25
-
26
-
27
-
28
-
29
-
30
-
31
-
32
-
33
-
34
-
35
-
36
-
37
-
38
-
39
-
40
-
41
-
42
-
43
-
44
-
45
-
46
-
47
-
48
-
49
-
50
-
51
-
52
-
53
-
54
-
55
-
56
-
57
-
58
-
 59
59 -
 60
60 -
 61
61 -
 62
62 -
 63
63 -
 64
64 -
 65
65 -
 66
66 -
 67
67 -
 68
68 -
 69
69 -
 70
70 -
 71
71 -
 72
72 -
 73
73 -
 74
74 -
 75
75 -
 76
76 -
 77
77 -
 78
78 -
 79
79 -
80
-
81
-
82
-
83
-
84
-
85
-
86
-
87
-
88
-
89
-
90
-
91
-
92
-
93
-
94
-
95
-
96
-
97
-
98
-
99
-
100
-
101
-
102
-
103
-
104
-
105
-
106
-
107
-
108
-
109
-
110
-
111
-
112
-
113
-
114
-
115
-
116
-
117
-
118
-
119
-
120
-
121
-
122
-
123
-
124
-
125
-
126
-
127
-
128
-
129
-
130
-
131
-
132
-
133
-
134
-
135
-
136
-
137
-
138
-
139
-
140
-
141
-
142
-
143
-
144
-
145
-
146
-
147
-
148
-
149
-
150
-
151
-
152
 |
 |
Item 7. MANAGEMENT’S DISCUSSION AND ANALYSIS OF FINANCIAL CONDITION AND
RESULTS OF OPERATIONS - Continued
59
LIQUIDITY AND CAPITAL RESOURCES
Cash, Cash Equivalents and Current Marketable Investment Securities
We consider all liquid investments purchased within 90 days of their maturity to be cash equivalents. See “Item 7A.
– Quantitative and Qualitative Disclosures About Market Risk” for further discussion regarding our marketable
investment securities. As of December 31, 2009, our cash, cash equivalents and current marketable investment
securities totaled $2.139 billion compared to $559 million as of December 31, 2008, an increase of $1.580 billion.
This increase in cash, cash equivalents and current marketable investment securities was primarily related to cash
generated from operations of $2.195 billion and the net proceeds of $1.377 billion related to our 7 % Senior Notes
due 2019 issued in 2009, partially offset by capital expenditures of $1.037 billion and the $894 million dividend paid
on our Class A and Class B common stock.
We have investments in various debt and equity instruments including corporate bonds, corporate equity securities,
government bonds, and variable rate demand notes (“VRDNs”). VRDNs are long-term floating rate municipal
bonds with embedded put options that allow the bondholder to sell the security at par plus accrued interest. All of
the put options are secured by a pledged liquidity source. Our VRDN portfolio is comprised of investments in many
municipalities, which are backed by financial institutions or other highly rated companies that serve as the pledged
liquidity source. While they are classified as marketable investment securities, the put option allows VRDNs to be
liquidated on a same day or on a five business day settlement basis. As of December 31, 2009 and 2008, we held
VRDNs with fair values of $1.054 billion and $240 million, respectively.
The following discussion highlights our cash flow activities during the years ended December 31, 2009, 2008 and
2007.
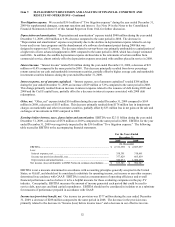
Free Cash Flow
We define free cash flow as “Net cash flows from operating activities” less “Purchases of property and equipment,”
as shown on our Consolidated Statements of Cash Flows. We believe free cash flow is an important liquidity metric
because it measures, during a given period, the amount of cash generated that is available to repay debt obligations,
make investments, fund acquisitions and for certain other activities. Free cash flow is not a measure determined in
accordance with GAAP and should not be considered a substitute for “Operating income,” “Net income,” “Net cash
flows from operating activities” or any other measure determined in accordance with GAAP. Since free cash flow
includes investments in operating assets, we believe this non-GAAP liquidity measure is useful in addition to the
most directly comparable GAAP measure “Net cash flows from operating activities.”
During the years ended December 31, 2009, 2008 and 2007, free cash flow was significantly impacted by changes in
operating assets and liabilities as shown in the “Net cash flows from operating activities” section of our Consolidated
Statements of Cash Flows included herein. Operating asset and liability balances can fluctuate significantly from
period to period and there can be no assurance that free cash flow will not be negatively impacted by material changes
in operating assets and liabilities in future periods, since these changes depend upon, among other things,
management’s timing of payments and control of inventory levels, and cash receipts. In addition to fluctuations
resulting from changes in operating assets and liabilities, free cash flow can vary significantly from period to period
depending upon, among other things, subscriber growth, subscriber revenue, subscriber churn, subscriber acquisition
costs including amounts capitalized under our equipment lease programs, operating efficiencies, increases or decreases
in purchases of property and equipment and other factors.