Dell 2006 Annual Report Download - page 53
Download and view the complete annual report
Please find page 53 of the 2006 Dell annual report below. You can navigate through the pages in the report by either clicking on the pages listed below, or by using the keyword search tool below to find specific information within the annual report.-
 1
1 -
2
-
3
-
4
-
5
-
6
-
7
-
8
-
9
-
10
-
11
-
12
-
13
-
14
-
15
-
16
-
17
-
18
-
19
-
20
-
21
-
22
-
23
-
24
-
25
-
26
-
27
-
28
-
29
-
30
-
31
-
32
-
33
-
34
-
35
-
36
-
37
-
38
-
39
-
40
-
41
-
42
-
 43
43 -
 44
44 -
 45
45 -
 46
46 -
 47
47 -
 48
48 -
 49
49 -
 50
50 -
 51
51 -
 52
52 -
 53
53 -
 54
54 -
 55
55 -
 56
56 -
 57
57 -
 58
58 -
 59
59 -
 60
60 -
 61
61 -
 62
62 -
 63
63 -
64
-
65
-
66
-
67
-
68
-
69
-
70
-
71
-
72
-
73
-
74
-
75
-
76
-
77
-
78
-
79
-
80
-
81
-
82
-
83
-
84
-
85
-
86
-
87
-
88
-
89
-
90
-
91
-
92
-
93
-
94
-
95
-
96
-
97
-
98
-
99
-
100
-
101
-
102
-
103
-
104
-
105
-
106
-
107
-
108
-
109
-
110
-
111
-
112
-
113
-
114
-
115
-
116
-
117
-
118
-
119
-
120
-
121
-
122
-
123
-
124
-
125
-
126
-
127
-
128
-
129
-
130
-
131
-
132
-
133
-
134
-
135
-
136
-
137
-
138
-
139
-
140
-
141
-
142
-
143
-
144
-
145
-
146
-
147
-
148
-
149
-
150
-
151
-
152
-
153
-
154
-
155
-
156
-
157
-
158
-
159
-
160
-
161
-
162
-
163
-
164
-
165
-
166
-
167
-
168
-
169
-
170
-
171
-
172
-
173
-
174
-
175
-
176
 |
 |

Table of Contents
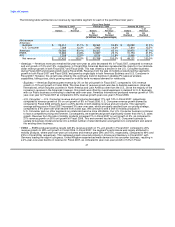
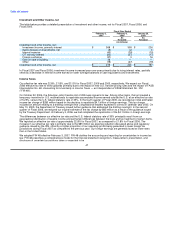
annual cash flows from operating activities that typically exceed net income. The following table presents the components
of our cash conversion cycle for each of the past three fiscal years:
February 2, February 3, January 28,
2007 2006 2005
As As
Restated Restated
Days of sales outstanding(a)(d) 31 29 27
Days of supply in inventory(b) 5 5 4
Days in accounts payable(c) (78) (77) (73)
Cash conversion cycle (42) (43) (42)
(a) Days of sales outstanding ("DSO") is based on the ending net trade receivables and most recent quarterly revenue for each period. DSO includes
the effect of product costs related to customer shipments not yet recognized as revenue that are classified in other current assets. At February 2,
2007, February 3, 2006, and January 28, 2005, DSO and days of customer shipments not yet recognized were 28 and 3 days, 26 and 3 days,
and 24 and 3 days, respectively.
(b) Days of supply in inventory is based on ending inventory and most recent quarterly cost of sales for each period.
(c) Days in accounts payable is based on ending accounts payable and most recent quarterly cost of sales for each period.
(d) Financing receivables have been separately classified on the balance sheet beginning February 3, 2006. As a result, days of sales outstanding
has been recalculated for January 28, 2005 to reflect the change in classification of certain items previously included in accounts receivable to
financing receivables.
Our cash conversion cycle decreased one day at February 2, 2007 from February 3, 2006. This decline was driven by a
two-day increase in days of sales outstanding largely attributed to higher percentage of our revenue coming from outside
the U.S., where payment terms are customarily longer and a higher percentage of revenue occurring at the end of the
period. This decline was offset by a one-day increase in days in accounts payable largely attributed to an increase in the
number of suppliers with extended payment terms as compared to Fiscal 2006.
We defer the cost of revenue associated with customer shipments not yet recognized as revenue until they are delivered.
These deferred costs are included in our reported days of sales outstanding because we believe it presents a more
accurate presentation of our days of sales outstanding and cash conversion cycle. These deferred costs are recorded in
other current assets in our Consolidated Statements of Financial Position and totaled $424 million, $417 million, and
$361 million at February 2, 2007, February 3, 2006 and January 28, 2005, respectively.
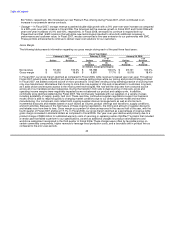
• Investing Activities — Cash provided by investing activities during Fiscal 2007 was $1.0 billion, as compared to $4.1 billion
provided in Fiscal 2006 and $1.7 billion used in Fiscal 2005. Cash generated or used in investing activities principally
consists of net maturities and sales or purchases of investments, net of capital expenditures for property, plant, and
equipment. In Fiscal 2007 compared to Fiscal 2006, we had a lower amount of proceeds from maturities and sales of
investments, and this was partially offset by an increase in capital expenditures as we continued to focus on investing in our
global infrastructure in order to support our rapid global growth.
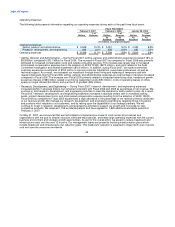
• Financing Activities — Cash used in financing activities during Fiscal 2007 was $2.6 billion, as compared to $6.3 billion in
Fiscal 2006 and $3.1 billion in Fiscal 2005. Financing activities primarily consist of the repurchase of our common stock,
partially offset by proceeds from the issuance of common stock under employee stock plans and other items. In Fiscal
2007, the year-over-year decrease in cash used in financing activities is due primarily to the suspension of our share
repurchase program in September 2006. During Fiscal 2007, we repurchased approximately 118 million shares at an
aggregate cost of $3.0 billion compared to 204 million shares at an aggregate cost of $7.2 billion in Fiscal 2006 and
119 million shares at an aggregate cost of $4.2 billion in Fiscal 2005. In Fiscal 2006, the increase in share repurchases
compared to Fiscal 2005 drove the year-over-year increase in cash used in financing activities.
We believe our ability to generate cash flows from operations on an annual basis will continue to be strong, driven mainly by
our profitability, efficient cash conversion cycle, and the growth in our deferred enhanced
50