Dell 2006 Annual Report Download - page 28
Download and view the complete annual report
Please find page 28 of the 2006 Dell annual report below. You can navigate through the pages in the report by either clicking on the pages listed below, or by using the keyword search tool below to find specific information within the annual report.-
 1
1 -
2
-
3
-
4
-
5
-
6
-
7
-
8
-
9
-
10
-
11
-
12
-
13
-
14
-
15
-
16
-
17
-
 18
18 -
 19
19 -
 20
20 -
 21
21 -
 22
22 -
 23
23 -
 24
24 -
 25
25 -
 26
26 -
 27
27 -
 28
28 -
 29
29 -
 30
30 -
 31
31 -
 32
32 -
 33
33 -
 34
34 -
 35
35 -
 36
36 -
 37
37 -
 38
38 -
39
-
40
-
41
-
42
-
43
-
44
-
45
-
46
-
47
-
48
-
49
-
50
-
51
-
52
-
53
-
54
-
55
-
56
-
57
-
58
-
59
-
60
-
61
-
62
-
63
-
64
-
65
-
66
-
67
-
68
-
69
-
70
-
71
-
72
-
73
-
74
-
75
-
76
-
77
-
78
-
79
-
80
-
81
-
82
-
83
-
84
-
85
-
86
-
87
-
88
-
89
-
90
-
91
-
92
-
93
-
94
-
95
-
96
-
97
-
98
-
99
-
100
-
101
-
102
-
103
-
104
-
105
-
106
-
107
-
108
-
109
-
110
-
111
-
112
-
113
-
114
-
115
-
116
-
117
-
118
-
119
-
120
-
121
-
122
-
123
-
124
-
125
-
126
-
127
-
128
-
129
-
130
-
131
-
132
-
133
-
134
-
135
-
136
-
137
-
138
-
139
-
140
-
141
-
142
-
143
-
144
-
145
-
146
-
147
-
148
-
149
-
150
-
151
-
152
-
153
-
154
-
155
-
156
-
157
-
158
-
159
-
160
-
161
-
162
-
163
-
164
-
165
-
166
-
167
-
168
-
169
-
170
-
171
-
172
-
173
-
174
-
175
-
176
 |
 |

Table of Contents
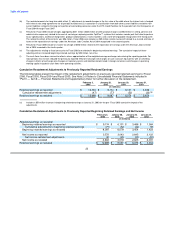
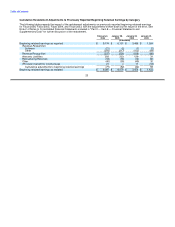
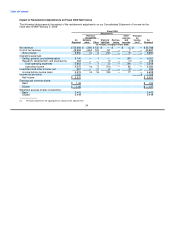
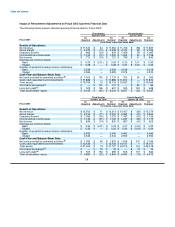
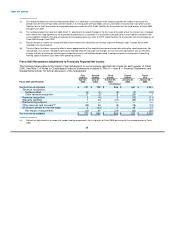
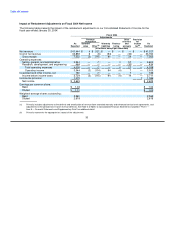
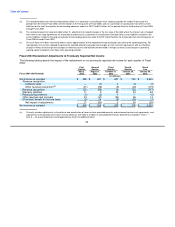
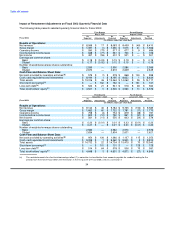
Impact of Restatement Adjustments on Fiscal 2006 Quarterly Financial Data
The following tables present selected quarterly financial data for Fiscal 2006:
First Quarter Second Quarter(c)
April 29, 2005 July 29, 2005
As As As As
Fiscal 2006 Reported Adjustments Restated Reported Adjustments Restated
(in millions, expect per share data)
Results of Operations:
Net revenue $ 13,386 $ (86) $ 13,300 $ 13,428 $ (46) $ 13,382
Gross margin $ 2,491 $ (39) $ 2,452 $ 2,499 $ (68) $ 2,431
Operating income $ 1,174 $ (37) $ 1,137 $ 1,173 $ (60) $ 1,113
Income before income taxes $ 1,233 $ (45) $ 1,188 $ 1,234 $ (47) $ 1,187
Net income $ 934 $ (26) $ 908 $ 1,020 $ (38) $ 982
Earnings per common share:
Basic $ 0.38 $ (0.01) $ 0.37 $ 0.42 $ (0.01) $ 0.41
Diluted $ 0.37 $ (0.01) $ 0.36 $ 0.41 $ (0.01) $ 0.40
Number of weighted-average shares outstanding:
Basic 2,456 — 2,456 2,418 — 2,418
Diluted 2,515 — 2,515 2,478 — 2,478
Cash Flow and Balance Sheet Data:
Net cash provided by operating activities(d) $ 1,190 $ 84 $ 1,274 $ 919 $ (58) $ 861
Cash, cash equivalents and investments $ 13,374 $ 4 $ 13,378 $ 12,624 $ 6 $ 12,630
Total assets $ 22,687 $ 82 $ 22,769 $ 22,611 $ 107 $ 22,718
Short-term borrowings(a) $ — $ 81 $ 81 $ — $ 77 $ 77
Long-term debt(b) $ 504 $ 140 $ 644 $ 504 $ 135 $ 639
Total stockholders' equity $ 5,624 $ (100) $ 5,524 $ 5,509 $ (144) $ 5,365
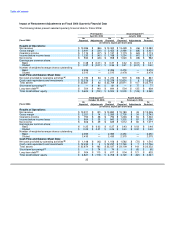
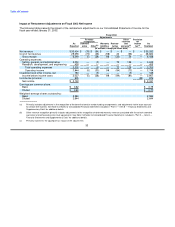
Third Quarter(c) Fourth Quarter
October 28, 2005 February 3, 2006
As As As As
Fiscal 2006 Reported Adjustments Restated Reported Adjustments Restated
(in millions, expect per share data)
Results of Operations:
Net revenue $ 13,911 $ (31) $ 13,880 $ 15,183 $ 43 $ 15,226
Gross margin $ 2,251 $ 14 $ 2,265 $ 2,709 $ 34 $ 2,743
Operating income $ 754 $ 38 $ 792 $ 1,246 $ 94 $ 1,340
Income before income taxes $ 804 $ 39 $ 843 $ 1,303 $ 87 $ 1,390
Net income $ 606 $ 29 $ 635 $ 1,012 $ 65 $ 1,077
Earnings per common share:
Basic $ 0.25 $ 0.02 $ 0.27 $ 0.43 $ 0.03 $ 0.46
Diluted $ 0.25 $ 0.01 $ 0.26 $ 0.43 $ 0.02 $ 0.45
Number of weighted-average shares outstanding:
Basic 2,395 — 2,395 2,350 — 2,350
Diluted 2,435 — 2,435 2,375 — 2,375
Cash Flow and Balance Sheet Data:
Net cash provided by operating activities(d) $ 1,148 $ (42) $ 1,106 $ 1,582 $ (72) $ 1,510
Cash, cash equivalents and investments $ 12,233 $ 4 $ 12,237 $ 11,749 $ 7 $ 11,756
Total assets $ 22,874 $ 163 $ 23,037 $ 23,109 $ 143 $ 23,252
Short-term borrowings(a) $ — $ 74 $ 74 $ — $ 65 $ 65
Long-term debt(b) $ 504 $ 113 $ 617 $ 504 $ 121 $ 625
Total stockholders' equity $ 4,821 $ (113) $ 4,708 $ 4,129 $ (82) $ 4,047
25