DHL 2000 Annual Report Download - page 8
Download and view the complete annual report
Please find page 8 of the 2000 DHL annual report below. You can navigate through the pages in the report by either clicking on the pages listed below, or by using the keyword search tool below to find specific information within the annual report.-
 1
1 -
 2
2 -
 3
3 -
 4
4 -
 5
5 -
 6
6 -
 7
7 -
 8
8 -
 9
9 -
 10
10 -
 11
11 -
 12
12 -
 13
13 -
 14
14 -
 15
15 -
 16
16 -
 17
17 -
 18
18 -
 19
19 -
20
-
21
-
22
-
23
-
24
-
25
-
26
-
27
-
28
-
29
-
30
-
31
-
32
-
33
-
34
-
35
-
36
-
37
-
38
-
39
-
40
-
41
-
42
-
43
-
44
-
45
-
46
-
47
-
48
-
49
-
50
-
51
-
52
-
53
-
54
-
55
-
56
-
57
-
58
-
59
-
60
-
61
-
62
-
63
-
64
-
65
-
66
-
67
-
68
-
69
-
70
-
71
-
72
-
73
-
74
-
75
-
76
-
77
-
78
-
79
-
80
-
81
-
82
-
83
-
84
-
85
-
86
-
87
-
88
-
89
-
90
-
91
-
92
-
93
-
94
-
95
-
96
-
97
-
98
-
99
-
100
-
101
-
102
-
103
-
104
-
105
-
106
-
107
-
108
-
109
-
110
-
111
-
112
-
113
-
114
-
115
-
116
-
117
-
118
-
119
-
120
-
121
-
122
-
123
-
124
-
125
-
126
-
127
-
128
-
129
-
130
-
131
-
132
-
133
-
134
-
135
-
136
-
137
-
138
-
139
-
140
-
141
-
142
-
143
-
144
-
145
-
146
-
147
-
148
-
149
-
150
-
151
-
152
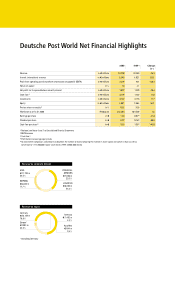
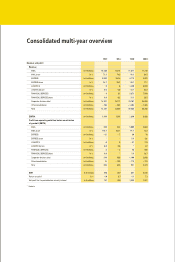
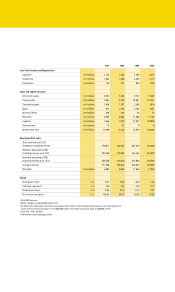
 |
 |

1997 1998 1999 2000
Cash flow/Investments/Depreciation
Cash flow 2) in
€
millions 1,145 1,382 1,462 3,479
Investments in
€
millions 1,084 1,400 4,553 3,113
Depreciation in
€
millions 743 741 993 1,204
Asset and capital structure
Non-current assets in
€
millions 9,907 9,485 9,791 11,081
Current assets in
€
millions 2,854 4,448 62,957 137,381
Deferred tax assets in
€
millions 1,029 1,187 2,268 1,818
Equity in
€
millions 994 1,765 2,564 4,001
Minority interest in
€
millions 226 229 56 79
Provisions in
€
millions 9,293 9,302 11,009 11,107
Liabilities in
€
millions 3,265 3,792 61,387 135,093
Deferred items in
€
millions 12 32 0 0
Balance sheet total in
€
millions 13,790 15,120 75,016 150,280
Employees/Staff costs
Total workforce as at 12.31
(headcount) (including trainees) 270,817 260,520 301,229 324,203
Workforce calculated as FTEs
(including trainees) as at 12.31 233,350 223,863 264,424 284,890
Workforce calculated as FTEs
(excluding trainees) as at 12.31 228,758 218,916 257,836 278,705
Average workforce 277,538 263,342 304,265 319,998
Staff costs in
€
millions 9,992 9,860 11,503 11,056
Ratios
Earnings per share3) in
€
0.67 0.83 0.92 1.36
Cash flow4)
per share3)
in
€
1.03 1.24 1.30 3.13
Dividend per share3) in
€
0.05 0.14 0.16 0.27
Pre-tax return on equity5) in % 133.84 63.07 35.85 62.09
1) Total EBITA/revenue
2) Before changes in working capital/cash flow I
3) To allow better comparison, calculation was based on the number of shares following the increase in the share capital and
switch to
€
as well as conversion to 1,112,800,000 no-par value shares (in previous years: 42,800,000 shares).
4) Cash flow I forms the basis.
5) Profit before tax/average equity levels