Chrysler 2000 Annual Report Download - page 43
Download and view the complete annual report
Please find page 43 of the 2000 Chrysler annual report below. You can navigate through the pages in the report by either clicking on the pages listed below, or by using the keyword search tool below to find specific information within the annual report.-
 1
1 -
2
-
3
-
4
-
5
-
6
-
7
-
8
-
9
-
10
-
11
-
12
-
13
-
14
-
15
-
16
-
17
-
18
-
19
-
20
-
21
-
22
-
23
-
24
-
25
-
26
-
27
-
28
-
29
-
30
-
31
-
32
-
 33
33 -
 34
34 -
 35
35 -
 36
36 -
 37
37 -
 38
38 -
 39
39 -
 40
40 -
 41
41 -
 42
42 -
 43
43 -
 44
44 -
 45
45 -
 46
46 -
 47
47 -
 48
48 -
 49
49 -
 50
50 -
 51
51 -
 52
52 -
 53
53 -
54
-
55
-
56
-
57
-
58
-
59
-
60
-
61
-
62
-
63
-
64
-
65
-
66
-
67
-
68
-
69
-
70
-
71
-
72
-
73
-
74
-
75
-
76
-
77
-
78
-
79
-
80
-
81
-
82
-
83
-
84
-
85
-
86
-
87
 |
 |

A breakdown of the changes affecting the net financial
position in 2000 is provided below:
(in millions of euros)
Net financial position at December 31, 1999 (4,031)
Increase in working capital (732)
Investments in fixed assets (3,236)
Cash flow 3,630
Dividends paid by Fiat S.p.A. (352)
Dividends paid by other companies (60)
Acquisitions and capital contributions (4,347)
Disposals (net of capital gains) 1,040
Other changes 1,621
Total change (2,436)
Net financial position at December 31, 2000 (6,467)
Cash flow, which is equal to net income before minority
interest plus depreciation and amortization, climbed sharply
to 3,630 million euros from 2,860 million euros in 1999 as
a result of higher depreciation and amortization charges.
Depreciation and amortization rose to 3,052 million euros
(up from 2,354 million euros in 1999), due largely to higher
amortization for goodwill, particularly as a result of the Case
acquisition and the widening of the scope of consolidation.
Disposals included the sale of a 20% interest in Fiat Auto
to General Motors. This value does not reflect realized capital
gains since they were already included in cash flow.
The other changes consist mainly of changes in the scope
of consolidation, the impact of exchange rates and increased
allowances made for industrial reorganization and the
strengthening of the asset base of several Group Sectors.
A breakdown of the net financial position is provided below:
(in millions of euros) 12/31/00 12/31/99
Cash 1,997 1,906
Marketable securities 1,643 1,613
Financial receivables and leased assets 24,059 19,103
Accrued financial income 620 295
Deferred financial income (1,778) (1,892)
Total financial assets (A)26,541 21,025
Short-term debt (17,217) (14,073)
Long-term debt (15,272) (10,756)
Accrued financial expenses (649) (309)
Deferred financial expenses 130 82
Total financial liabilities (B)(33,008) (25,056)
Group's net financial position (A-B)(6,467) (4,031)
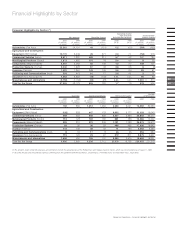
Stockholders’ equity
Stockholders’ equity totaled 15,209 million euros at
December 31, 2000, compared with 14,767 million euros at
the end of 1999. The Group's interest in stockholders’ equity
amounted to 13,320 million euros versus 12,874 million euros
in the previous fiscal year. The debt to equity ratio rose from
0.27 at the end of 1999 to 0.43 at the end of 2000.
A breakdown of the changes in stockholders’ equity is
provided in the Notes to the Consolidated Financial
Statements.
Stockholders’ Equity
(in millions of euros)
2000
15,209
19991998
14,767
15,120
Minority
Group
1,889
13,320
1,893
12,874
2,122
12,998