Chrysler 2000 Annual Report Download - page 3
Download and view the complete annual report
Please find page 3 of the 2000 Chrysler annual report below. You can navigate through the pages in the report by either clicking on the pages listed below, or by using the keyword search tool below to find specific information within the annual report.-
 1
1 -
 2
2 -
 3
3 -
 4
4 -
 5
5 -
 6
6 -
 7
7 -
 8
8 -
 9
9 -
 10
10 -
 11
11 -
 12
12 -
 13
13 -
 14
14 -
15
-
16
-
17
-
18
-
19
-
20
-
21
-
22
-
23
-
24
-
25
-
26
-
27
-
28
-
29
-
30
-
31
-
32
-
33
-
34
-
35
-
36
-
37
-
38
-
39
-
40
-
41
-
42
-
43
-
44
-
45
-
46
-
47
-
48
-
49
-
50
-
51
-
52
-
53
-
54
-
55
-
56
-
57
-
58
-
59
-
60
-
61
-
62
-
63
-
64
-
65
-
66
-
67
-
68
-
69
-
70
-
71
-
72
-
73
-
74
-
75
-
76
-
77
-
78
-
79
-
80
-
81
-
82
-
83
-
84
-
85
-
86
-
87
 |
 |

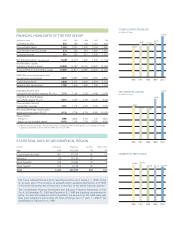
FINANCIAL HIGHLIGHTS OF THE FIAT GROUP
STATISTICAL DATA BY GEOGRAPHICAL REGION
Fiat S.p.A. adopted the euro as its reporting currency as of January 1, 1999, opting
for an early use of this currency, as allowed under Legislative Decree No. 213/1998
“Provisions Governing the Introduction of the Euro in the Italian National System.”
The Consolidated Financial Statements and Statutory Financial Statements of Fiat
S.p.A. at December 31, 2000 and December 31, 1999 are therefore denominated in
euros. To make the respective data comparable, the amounts for the 1998 fiscal year
have been restated in euros using the fixed exchange rate of 1 euro = 1,936.27 lire
established on December 31, 1998.
in millions of euros 2000 1999 1998 1997 1996
Operating income 855 788 746 1,791 932
Income before taxes 1,050 1,024 1,442 2,160 1,965
Income before minority interest 578 506 916 1,550 1,420
Group net income 664 353 621 1,248 1,225
Net financial position (Net borrowings) (6,467) (4,031)1,420 1,340 (1,142)
Stockholders’ equity
including minority interest
15,209 14,767 15,120 15,462 14,026
Group interest in stockholders’ equity 13,320 12,874 12,998 13,203 12,042
Cash flow (income before minority interest
plus depreciation and amortization) 3,630 2,860 3,226 4,184 3,867
Capital expenditures 3,236 2,712 2,418 2,398 2,746
Research and development 1,725 1,406 1,264 1,166 1,129
Operating income from
Industrial Activities/Net revenues (R.O.S.) 1.7% 1.9% 2.2% 4.4% 2.9%
Operating income/Average
net invested capital (R.O.I.) 4.2% 4.8% 5.4% 12.2% 6.3%
Income before minority
interest/Net revenues 1.0% 1.1% 2.0% 3.4% 3.5%
Net income/Average stockholders’
equity (after minority interest) (R.O.E.) 5.1% 2.7% 4.7% 9.9% 10.5%
Value creation
– Amount (*) (899) (480) (714) 144 (607)
– Return on net invested capital 6.0% 7.0% 7.7% 12.8% 8.5%
(*) Difference between operating income for the fiscal year (including investment income) and the cost of average net invested
capital at an annual rate of 10% in 2000 and 1999, and of 12% in 1998.
number Companies Employees Facilities R&D centers
Italy 244 112,224 75 70
Europe excluding Italy 457 57,421 82 37
Mercosur 68 29,180 22 9
North America 158 16,392 41 13
Other regions 136 8,736 22 2
Total 1,063 223,953 242 131
NUMBER OF EMPLOYEES
1998 1999 2000
223,953
221,319
220,549
1997
242,322
1996
237,865
NET INVESTED CAPITAL
1998 1999 2000
in millions of euros
21,676
18,798
13,700
1997
14,122
1996
15,168
CONSOLIDATED REVENUES
1998 1999 2000
in millions of euros
57,555
48,123
45,769
1997
46,257
1996
40,244