Chesapeake Energy 2015 Annual Report Download - page 9
Download and view the complete annual report
Please find page 9 of the 2015 Chesapeake Energy annual report below. You can navigate through the pages in the report by either clicking on the pages listed below, or by using the keyword search tool below to find specific information within the annual report.-
 1
1 -
 2
2 -
 3
3 -
 4
4 -
 5
5 -
 6
6 -
 7
7 -
 8
8 -
 9
9 -
 10
10 -
 11
11 -
 12
12 -
 13
13 -
 14
14 -
 15
15 -
 16
16 -
 17
17 -
 18
18 -
 19
19 -
 20
20 -
21
-
22
-
23
-
24
-
25
-
26
-
27
-
28
-
29
-
30
-
31
-
32
-
33
-
34
-
35
-
36
-
37
-
38
-
39
-
40
-
41
-
42
-
43
-
44
-
45
-
46
-
47
-
48
-
49
-
50
-
51
-
52
-
53
-
54
-
55
-
56
-
57
-
58
-
59
-
60
-
61
-
62
-
63
-
64
-
65
-
66
-
67
-
68
-
69
-
70
-
71
-
72
-
73
-
74
-
75
-
76
-
77
-
78
-
79
-
80
-
81
-
82
-
83
-
84
-
85
-
86
-
87
-
88
-
89
-
90
-
91
-
92
-
93
-
94
-
95
-
96
-
97
-
98
-
99
-
100
-
101
-
102
-
103
-
104
-
105
-
106
-
107
-
108
-
109
-
110
-
111
-
112
-
113
-
114
-
115
-
116
-
117
-
118
-
119
-
120
-
121
-
122
-
123
-
124
-
125
-
126
-
127
-
128
-
129
-
130
-
131
-
132
-
133
-
134
-
135
-
136
-
137
-
138
-
139
-
140
-
141
-
142
-
143
-
144
-
145
-
146
-
147
-
148
-
149
-
150
-
151
-
152
-
153
-
154
-
155
-
156
-
157
-
158
-
159
-
160
-
161
-
162
-
163
-
164
-
165
-
166
-
167
-
168
-
169
-
170
-
171
-
172
-
173
-
174
-
175
 |
 |

5
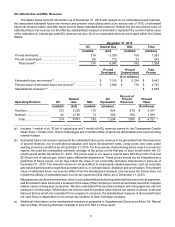
Oil, Natural Gas and NGL Reserves
The tables below set forth information as of December 31, 2015 with respect to our estimated proved reserves,
the associated estimated future net revenue and present value (discounted at an annual rate of 10%) of estimated
future net revenue before and after future income taxes (standardized measure). Neither the pre-tax present value of
estimated future net revenue nor the after-tax standardized measure is intended to represent the current market value
of the estimated oil, natural gas and NGL reserves we own. All of our estimated reserves are located within the United
States.
December 31, 2015
Oil Natural Gas NGL Total
(mmbbl) (bcf) (mmbbl) (mmboe)
Proved developed ............................................... 216 5,329 158 1,262
Proved undeveloped ........................................... 98 712 25 242
Total proved(a) ....................................................... 314 6,041 183 1,504
Proved
Developed Proved
Undeveloped Total
Proved
($ in millions)
Estimated future net revenue(b) ......................................................... $ 7,153 $ 2,334 $ 9,487
Present value of estimated future net revenue(b) ............................ $ 3,948 $ 779 $ 4,727
Standardized measure(b)(c) ............................................................................................................................ $ 4,693
Operating Division Oil Natural
Gas NGL Oil
Equivalent
Percent of
Proved
Reserves Present
Value
(mmbbl) (bcf) (mmbbl) (mmboe) ($ millions)
Southern .......................... 272 3,252 110 924 61% $ 3,347
Northern........................... 42 2,789 73 580 39% 1,380
Total............................. 314 6,041 183 1,504 100% $ 4,727 (b)
___________________________________________
(a) Includes 1 mmbbl of oil, 32 bcf of natural gas and 3 mmbbl of NGL reserves owned by the Chesapeake Granite
Wash Trust, 1 mmbbl of oil, 16 bcf of natural gas and 2 mmbbl of NGL of which are attributable to the noncontrolling
interest holders.
(b) Estimated future net revenue represents the estimated future gross revenue to be generated from the production
of proved reserves, net of estimated production and future development costs, using prices and costs under
existing economic conditions as of December 31, 2015. For the purpose of determining prices used in our reserve
reports, we used the unweighted arithmetic average of the prices on the first day of each month within the 12-
month period ended December 31, 2015. The prices used in our reserve reports were $50.28 per bbl of oil and
$2.58 per mcf of natural gas, before basis differential adjustments. These prices should not be interpreted as a
prediction of future prices, nor do they reflect the value of our commodity derivative instruments in place as of
December 31, 2015. The amounts shown do not give effect to nonproperty-related expenses, such as corporate
general and administrative expenses and debt service, or to depreciation, depletion and amortization. The present
value of estimated future net revenue differs from the standardized measure only because the former does not
include the effects of estimated future income tax expenses ($34 million as of December 31, 2015).
Management uses future net revenue, which is calculated without deducting estimated future income tax expenses,
and the present value thereof as a measure of the value of the Company's current proved reserves and to compare
relative values among peer companies. We also understand that securities analysts and rating agencies use this
measure in similar ways. While future net revenue and the present value thereof are based on prices, costs and
discount factors which are consistent from company to company, the standardized measure of discounted future
net cash flows is dependent on the unique tax situation of each individual company.
(c) Additional information on the standardized measure is presented in Supplemental Disclosures About Oil, Natural
Gas and NGL Producing Activities included in Item 8 of Part II of this report.