Chesapeake Energy 2015 Annual Report Download - page 5
Download and view the complete annual report
Please find page 5 of the 2015 Chesapeake Energy annual report below. You can navigate through the pages in the report by either clicking on the pages listed below, or by using the keyword search tool below to find specific information within the annual report.-
 1
1 -
 2
2 -
 3
3 -
 4
4 -
 5
5 -
 6
6 -
 7
7 -
 8
8 -
 9
9 -
 10
10 -
 11
11 -
 12
12 -
 13
13 -
 14
14 -
 15
15 -
 16
16 -
17
-
18
-
19
-
20
-
21
-
22
-
23
-
24
-
25
-
26
-
27
-
28
-
29
-
30
-
31
-
32
-
33
-
34
-
35
-
36
-
37
-
38
-
39
-
40
-
41
-
42
-
43
-
44
-
45
-
46
-
47
-
48
-
49
-
50
-
51
-
52
-
53
-
54
-
55
-
56
-
57
-
58
-
59
-
60
-
61
-
62
-
63
-
64
-
65
-
66
-
67
-
68
-
69
-
70
-
71
-
72
-
73
-
74
-
75
-
76
-
77
-
78
-
79
-
80
-
81
-
82
-
83
-
84
-
85
-
86
-
87
-
88
-
89
-
90
-
91
-
92
-
93
-
94
-
95
-
96
-
97
-
98
-
99
-
100
-
101
-
102
-
103
-
104
-
105
-
106
-
107
-
108
-
109
-
110
-
111
-
112
-
113
-
114
-
115
-
116
-
117
-
118
-
119
-
120
-
121
-
122
-
123
-
124
-
125
-
126
-
127
-
128
-
129
-
130
-
131
-
132
-
133
-
134
-
135
-
136
-
137
-
138
-
139
-
140
-
141
-
142
-
143
-
144
-
145
-
146
-
147
-
148
-
149
-
150
-
151
-
152
-
153
-
154
-
155
-
156
-
157
-
158
-
159
-
160
-
161
-
162
-
163
-
164
-
165
-
166
-
167
-
168
-
169
-
170
-
171
-
172
-
173
-
174
-
175
 |
 |
1
PART I
Item 1. Business
Unless the context otherwise requires, references to “Chesapeake”, the “Company”, “us”, “we” and “our” in this
report are to Chesapeake Energy Corporation together with its subsidiaries. Our principal executive offices are located
at 6100 North Western Avenue, Oklahoma City, Oklahoma 73118, and our main telephone number at that location is
(405) 848-8000. Definitions of oil and gas industry terms appearing in this report can be found under Glossary of Oil
and Gas Terms beginning on page 19.
Our Business
Chesapeake is currently the second-largest producer of natural gas and the 14th largest producer of oil and natural
gas liquids (NGL) in the United States. We own interests in approximately 43,700 oil and natural gas wells and produced
an average of approximately 661 mboe per day in the 2015 fourth quarter, net to our interest. We have a large and
geographically diverse resource base of onshore U.S. unconventional natural gas and liquids assets. We have leading
positions in the liquids-rich resource plays of the Eagle Ford Shale in South Texas; the Utica Shale in Ohio and
Pennsylvania; the Anadarko Basin in northwestern Oklahoma and the Texas Panhandle; and the Niobrara Shale in
the Powder River Basin in Wyoming. Our natural gas resource plays are the Haynesville/Bossier Shales in northwestern
Louisiana and East Texas; the Marcellus Shale in the northern Appalachian Basin in Pennsylvania; and the Barnett
Shale in the Fort Worth Basin of north-central Texas. We also own oil and natural gas marketing and natural gas
gathering and compression businesses.
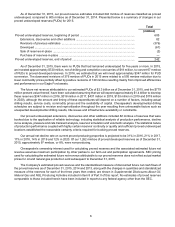
The Company's estimated proved reserves as of December 31, 2015 were 1.504 bboe, a decrease of 965 mmboe,
or 39%, from 2.469 bboe as of December 31, 2014. The 2015 proved reserve movement included 1.098 bboe of
downward revisions resulting primarily from lower average oil and natural gas prices offset by 231 mmboe of extensions
and discoveries and 213 mmboe of upward revisions resulting from changes to previous estimates as further discussed
below in Oil, Natural Gas and NGL Reserves and in Supplemental Disclosures About Oil, Natural Gas and NGL
Producing Activities included in Item 8 of Part II of this report. In 2015, we produced 248 mmboe and divested 63
mmboe of estimated proved reserves. Before basis differential adjustments, oil and natural gas prices used in estimating
proved reserves decreased substantially as of December 31, 2015 compared to December 31, 2014 using the trailing
12-month average prices required by the Securities and Exchange Commission (SEC). Oil prices decreased by $44.70
per bbl, or 47%, to $50.28 per bbl from $94.98 per bbl. Natural gas prices decreased $1.77 per mcf, or 41%, to $2.58
per mcf from $4.35 per mcf. Proved developed reserves represented 84% of our proved reserves as of December 31,
2015 compared to 75% as of December 31, 2014.
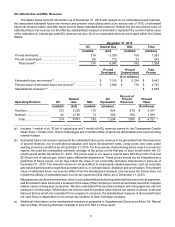
Our daily production for 2015 averaged 679 mboe, a decrease of 27 mboe, or 4%, from the 706 mboe of daily
production for 2014, and consisted of approximately 114,000 bbls of oil (17% on an oil equivalent basis), approximately
2.9 bcf of natural gas (72% on an oil equivalent basis) and approximately 76,700 bbls of NGL (11% on an oil equivalent
basis). Our average daily oil production decreased by 2%, or approximately 2 mbbls per day; our average daily natural
gas production decreased by 2%, or approximately 69 mmcf per day; and our average daily NGL production decreased
by 15%, or approximately 14 mbbls per day over the average daily production for 2014.
Information About Us
We make available, free of charge on our website at www.chk.com, our annual reports on Form 10-K, quarterly
reports on Form 10-Q, current reports on Form 8-K, and any amendments to those reports as soon as reasonably
practicable after we electronically file such material with, or furnish it to, the SEC. From time to time, we also post
announcements, updates, events, investor information and presentations on our website in addition to copies of all
recent news releases. Documents and information on our website are not incorporated by reference herein.
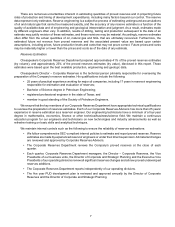
Business Strategy
Chesapeake’s strategy for 2016 is to focus on maximizing liquidity, improving margins and improving the value
of our significant positions in premier U.S. onshore resource plays. We continue to apply financial discipline to all
aspects of our business with the goal of increasing financial and operational flexibility through lower, value-driven
spending. Our 2016 capital program will be focused on efficient investments that can improve our cash flow generating
ability in a depressed commodity price environment. This strategy results in utilizing fewer rigs than in 2015, however,
to improve cash flow, we anticipate increasing completion crews to capitalize on prior investments and generate
revenues from initial production on new wells.