Chesapeake Energy 2015 Annual Report Download - page 10
Download and view the complete annual report
Please find page 10 of the 2015 Chesapeake Energy annual report below. You can navigate through the pages in the report by either clicking on the pages listed below, or by using the keyword search tool below to find specific information within the annual report.-
 1
1 -
 2
2 -
 3
3 -
 4
4 -
 5
5 -
 6
6 -
 7
7 -
 8
8 -
 9
9 -
 10
10 -
 11
11 -
 12
12 -
 13
13 -
 14
14 -
 15
15 -
 16
16 -
 17
17 -
 18
18 -
 19
19 -
 20
20 -
 21
21 -
22
-
23
-
24
-
25
-
26
-
27
-
28
-
29
-
30
-
31
-
32
-
33
-
34
-
35
-
36
-
37
-
38
-
39
-
40
-
41
-
42
-
43
-
44
-
45
-
46
-
47
-
48
-
49
-
50
-
51
-
52
-
53
-
54
-
55
-
56
-
57
-
58
-
59
-
60
-
61
-
62
-
63
-
64
-
65
-
66
-
67
-
68
-
69
-
70
-
71
-
72
-
73
-
74
-
75
-
76
-
77
-
78
-
79
-
80
-
81
-
82
-
83
-
84
-
85
-
86
-
87
-
88
-
89
-
90
-
91
-
92
-
93
-
94
-
95
-
96
-
97
-
98
-
99
-
100
-
101
-
102
-
103
-
104
-
105
-
106
-
107
-
108
-
109
-
110
-
111
-
112
-
113
-
114
-
115
-
116
-
117
-
118
-
119
-
120
-
121
-
122
-
123
-
124
-
125
-
126
-
127
-
128
-
129
-
130
-
131
-
132
-
133
-
134
-
135
-
136
-
137
-
138
-
139
-
140
-
141
-
142
-
143
-
144
-
145
-
146
-
147
-
148
-
149
-
150
-
151
-
152
-
153
-
154
-
155
-
156
-
157
-
158
-
159
-
160
-
161
-
162
-
163
-
164
-
165
-
166
-
167
-
168
-
169
-
170
-
171
-
172
-
173
-
174
-
175
 |
 |

6
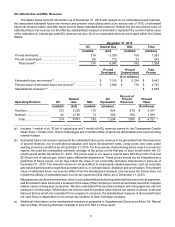
As of December 31, 2015, our proved reserve estimates included 242 mmboe of reserves classified as proved
undeveloped, compared to 605 mmboe as of December 31, 2014. Presented below is a summary of changes in our
proved undeveloped reserves (PUDs) for 2015.
Total
(mmboe)
Proved undeveloped reserves, beginning of period ..................................................................... 605
Extensions, discoveries and other additions .......................................................................... 82
Revisions of previous estimates ............................................................................................ (376)
Developed .............................................................................................................................. (67)
Sale of reserves-in-place ....................................................................................................... (2)
Purchase of reserves-in-place ............................................................................................... —
Proved undeveloped reserves, end of period ............................................................................... 242
As of December 31, 2015, there were no PUDs that had remained undeveloped for five years or more. In 2015,
we invested approximately $720 million, net of drilling and completion cost carries of $18 million, to convert 67 mmboe
of PUDs to proved developed reserves. In 2016, we estimate that we will invest approximately $347 million for PUD
conversion. The downward revisions of 376 mmboe of PUDs in 2015 were related to a 505 mmboe reduction due to
lower commodity prices partially offset by positive revisions of 129 mmboe resulting mainly from improved efficiencies
and performance in our Eagle Ford assets.
The future net revenue attributable to our estimated PUDs of $2.3 billion as of December 31, 2015, and the $779
million present value thereof, have been calculated assuming that we will expend approximately $1.4 billion to develop
these reserves ($347 million in 2016, $318 million in 2017, $437 million in 2018, $153 million in 2019 and $119 million
in 2020), although the amount and timing of these expenditures will depend on a number of factors, including actual
drilling results, service costs, commodity prices and the availability of capital. Chesapeake's developmental drilling
schedules are subject to revision and reprioritization throughout the year resulting from unknowable factors such as
unexpected developmental drilling results, title issues and infrastructure availability or constraints.
Our proved undeveloped extensions, discoveries and other additions included 82 mmboe of reserves that were
booked due to the application of reliable technology, including statistical analysis of production performance, decline
curve analysis, pressure and rate transient analysis, reservoir simulation and volumetric analysis. The statistical nature
of production performance coupled with highly certain reservoir continuity or quality and sufficient proved undeveloped
locations established the reasonable certainty criteria required for booking proved reserves.
Our annual net decline rate on current proved producing properties is projected to be 31% in 2016, 21% in 2017,
17% in 2018, 14% in 2019 and 12% in 2020. Of our 1,262 mmboe of proved developed reserves as of December 31,
2015, approximately 97 mmboe, or 8%, were non-producing.
Chesapeake's ownership interest used for calculating proved reserves and the associated estimated future net
revenue assumes maximum participation by other parties to our farm-out and participation agreements. SEC pricing
used for calculating the estimated future net revenue attributable to our proved reserves does not reflect actual market
prices for oil and natural gas production sold subsequent to December 31, 2015.
The Company's estimated proved reserves and the standardized measure of discounted future net cash flows of
the proved reserves as of December 31, 2015, 2014 and 2013, along with the changes in quantities and standardized
measure of the reserves for each of the three years then ended, are shown in Supplemental Disclosures About Oil,
Natural Gas and NGL Producing Activities included in Item 8 of Part II of this report. No estimates of proved reserves
comparable to those included herein have been included in reports to any federal agency other than the SEC.