Chesapeake Energy 2015 Annual Report Download - page 6
Download and view the complete annual report
Please find page 6 of the 2015 Chesapeake Energy annual report below. You can navigate through the pages in the report by either clicking on the pages listed below, or by using the keyword search tool below to find specific information within the annual report.-
 1
1 -
 2
2 -
 3
3 -
 4
4 -
 5
5 -
 6
6 -
 7
7 -
 8
8 -
 9
9 -
 10
10 -
 11
11 -
 12
12 -
 13
13 -
 14
14 -
 15
15 -
 16
16 -
 17
17 -
18
-
19
-
20
-
21
-
22
-
23
-
24
-
25
-
26
-
27
-
28
-
29
-
30
-
31
-
32
-
33
-
34
-
35
-
36
-
37
-
38
-
39
-
40
-
41
-
42
-
43
-
44
-
45
-
46
-
47
-
48
-
49
-
50
-
51
-
52
-
53
-
54
-
55
-
56
-
57
-
58
-
59
-
60
-
61
-
62
-
63
-
64
-
65
-
66
-
67
-
68
-
69
-
70
-
71
-
72
-
73
-
74
-
75
-
76
-
77
-
78
-
79
-
80
-
81
-
82
-
83
-
84
-
85
-
86
-
87
-
88
-
89
-
90
-
91
-
92
-
93
-
94
-
95
-
96
-
97
-
98
-
99
-
100
-
101
-
102
-
103
-
104
-
105
-
106
-
107
-
108
-
109
-
110
-
111
-
112
-
113
-
114
-
115
-
116
-
117
-
118
-
119
-
120
-
121
-
122
-
123
-
124
-
125
-
126
-
127
-
128
-
129
-
130
-
131
-
132
-
133
-
134
-
135
-
136
-
137
-
138
-
139
-
140
-
141
-
142
-
143
-
144
-
145
-
146
-
147
-
148
-
149
-
150
-
151
-
152
-
153
-
154
-
155
-
156
-
157
-
158
-
159
-
160
-
161
-
162
-
163
-
164
-
165
-
166
-
167
-
168
-
169
-
170
-
171
-
172
-
173
-
174
-
175
 |
 |
2
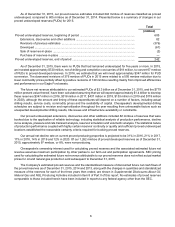
As part of a broader effort to decrease our financial complexity and increase our liquidity, we took the following
actions in 2015:
• reduced total capital expenditures in 2015 compared to 2014 by approximately 46% in response to the lower
commodity price environment;
• amended our revolving credit facility to give us greater flexibility and access to liquidity;
• exchanged certain senior notes for new secured second lien notes to reduce and extend our future debt and
interest obligations;
• eliminated quarterly dividends on our common stock;
• reduced our workforce by approximately 15% as part of an overall plan to reduce costs and better align our
workforce with the needs of our business and current oil and natural gas prices;
• removed drilling and overriding royalty interest commitments related to our CHK Cleveland Tonkawa (CHK
C-T) subsidiary; and
• restructured certain gathering agreements to improve our per-unit gathering rates beginning in 2016, satisfy
minimum volume commitment obligations and increase realized pricing per mcf of natural gas.
In 2016, we intend to build on these actions to better position Chesapeake to create additional value as we work
to improve liquidity and increase the value of our asset base. We expect our recent decision to suspend payment of
dividends on our convertible preferred stock and the sales of assets that do not fit in our strategic priorities to provide
increased liquidity. In addition, we are strengthening our balance sheet and improving our liquidity position by
repurchasing, at a discount, certain of our debt instruments that are scheduled to mature or are subject to a demand
repurchase in 2016 and 2017.
Our substantial inventory of hydrocarbon resources, including our undeveloped acreage, provides a strong
foundation to create future value. We have seen and continue to see increased efficiencies and operational
improvements, including increased well productivity from larger completions and lower production declines due to a
greater focus on strengthening our base production. Building on our strong and diverse asset base, we believe that
our dedication to financial discipline, the flexibility of our capital program, and our continued focus on safety and
environmental stewardship will provide many opportunities to create greater future value for Chesapeake and its
stakeholders in 2016 and beyond.
Operating Divisions
Chesapeake focuses its exploration, development, acquisition and production efforts in the two geographic
operating divisions described below.
Southern Division. Includes the Eagle Ford Shale in South Texas, the Anadarko Basin in northwestern Oklahoma
and the Texas Panhandle, the Haynesville/Bossier Shales in northwestern Louisiana and East Texas and the Barnett
Shale in the Fort Worth Basin in north-central Texas.
Northern Division. Includes the Utica Shale in Ohio and Pennsylvania, the Marcellus Shale in the northern
Appalachian Basin in Pennsylvania and the Niobrara Shale in the Powder River Basin in Wyoming.
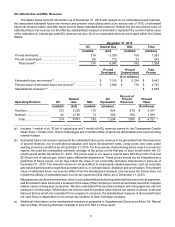
Well Data
As of December 31, 2015, we held an interest in approximately 43,700 gross (18,000 net) productive wells,
including 32,200 properties in which we held a working interest and 11,500 properties in which we held an overriding
or royalty interest. Of the wells in which we had a working interest, 27,000 gross (15,600 net) were classified as natural
gas productive wells and 5,200 gross (2,400 net) were classified as oil productive wells. Chesapeake operated
approximately 20,800 of its 32,200 productive wells in which we had a working interest. During 2015, we drilled or
participated in 611 gross (409 net) wells as operator and participated in another 203 gross (19 net) wells completed
by other operators. We operate approximately 92% of our current daily production volumes.