Chesapeake Energy 2015 Annual Report Download - page 8
Download and view the complete annual report
Please find page 8 of the 2015 Chesapeake Energy annual report below. You can navigate through the pages in the report by either clicking on the pages listed below, or by using the keyword search tool below to find specific information within the annual report.-
 1
1 -
 2
2 -
 3
3 -
 4
4 -
 5
5 -
 6
6 -
 7
7 -
 8
8 -
 9
9 -
 10
10 -
 11
11 -
 12
12 -
 13
13 -
 14
14 -
 15
15 -
 16
16 -
 17
17 -
 18
18 -
 19
19 -
20
-
21
-
22
-
23
-
24
-
25
-
26
-
27
-
28
-
29
-
30
-
31
-
32
-
33
-
34
-
35
-
36
-
37
-
38
-
39
-
40
-
41
-
42
-
43
-
44
-
45
-
46
-
47
-
48
-
49
-
50
-
51
-
52
-
53
-
54
-
55
-
56
-
57
-
58
-
59
-
60
-
61
-
62
-
63
-
64
-
65
-
66
-
67
-
68
-
69
-
70
-
71
-
72
-
73
-
74
-
75
-
76
-
77
-
78
-
79
-
80
-
81
-
82
-
83
-
84
-
85
-
86
-
87
-
88
-
89
-
90
-
91
-
92
-
93
-
94
-
95
-
96
-
97
-
98
-
99
-
100
-
101
-
102
-
103
-
104
-
105
-
106
-
107
-
108
-
109
-
110
-
111
-
112
-
113
-
114
-
115
-
116
-
117
-
118
-
119
-
120
-
121
-
122
-
123
-
124
-
125
-
126
-
127
-
128
-
129
-
130
-
131
-
132
-
133
-
134
-
135
-
136
-
137
-
138
-
139
-
140
-
141
-
142
-
143
-
144
-
145
-
146
-
147
-
148
-
149
-
150
-
151
-
152
-
153
-
154
-
155
-
156
-
157
-
158
-
159
-
160
-
161
-
162
-
163
-
164
-
165
-
166
-
167
-
168
-
169
-
170
-
171
-
172
-
173
-
174
-
175
 |
 |

4
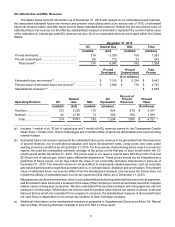
Production, Sales Prices, Production and Gathering, Processing and Transportation Expenses
The following table sets forth information regarding our production volumes, oil, natural gas and NGL sales,
average sales prices received and production and gathering, processing and transportation expenses for the periods
indicated:
Years Ended December 31,
2015 2014 2013
Net Production:
Oil (mmbbl) ................................................................................................ 42 42 41
Natural gas (bcf) ........................................................................................ 1,070 1,095 1,095
NGL (mmbbl) ............................................................................................. 28 33 21
Oil equivalent (mmboe)(a) .................................................................................. 248 258 244
Average Sales Price (excluding gains (losses) on derivatives):
Oil ($ per bbl) ............................................................................................. $ 45.77 $ 89.41 $ 96.78
Natural gas ($ per mcf) .............................................................................. $ 2.31 $ 4.14 $ 3.44
NGL ($ per bbl) .......................................................................................... $ 14.06 $ 30.95 $ 36.08
Oil equivalent ($ per boe) .......................................................................... $ 19.23 $ 36.21 $ 34.77
Average Sales Price (including realized gains (losses) on derivatives):
Oil ($ per bbl) ............................................................................................. $ 66.91 $ 85.04 $ 94.14
Natural gas ($ per mcf) .............................................................................. $ 2.72 $ 3.97 $ 3.45
NGL ($ per bbl) .......................................................................................... $ 14.06 $ 30.95 $ 36.08
Oil equivalent ($ per boe) .......................................................................... $ 24.54 $ 34.74 $ 34.36
Expenses ($ per boe):
Oil, natural gas and NGL production.......................................................... $ 4.22 $ 4.69 $ 4.74
Oil, natural gas and NGL gathering, processing and transportation .......... $ 8.55 $ 8.43 $ 6.44
___________________________________________
(a) Oil equivalent is based on six mcf of natural gas to one barrel of oil or one barrel of NGL. This ratio reflects an
energy content equivalency and not a price or revenue equivalency.