Chesapeake Energy 2015 Annual Report Download - page 2
Download and view the complete annual report
Please find page 2 of the 2015 Chesapeake Energy annual report below. You can navigate through the pages in the report by either clicking on the pages listed below, or by using the keyword search tool below to find specific information within the annual report.-
 1
1 -
 2
2 -
 3
3 -
 4
4 -
 5
5 -
 6
6 -
 7
7 -
 8
8 -
 9
9 -
 10
10 -
 11
11 -
 12
12 -
 13
13 -
14
-
15
-
16
-
17
-
18
-
19
-
20
-
21
-
22
-
23
-
24
-
25
-
26
-
27
-
28
-
29
-
30
-
31
-
32
-
33
-
34
-
35
-
36
-
37
-
38
-
39
-
40
-
41
-
42
-
43
-
44
-
45
-
46
-
47
-
48
-
49
-
50
-
51
-
52
-
53
-
54
-
55
-
56
-
57
-
58
-
59
-
60
-
61
-
62
-
63
-
64
-
65
-
66
-
67
-
68
-
69
-
70
-
71
-
72
-
73
-
74
-
75
-
76
-
77
-
78
-
79
-
80
-
81
-
82
-
83
-
84
-
85
-
86
-
87
-
88
-
89
-
90
-
91
-
92
-
93
-
94
-
95
-
96
-
97
-
98
-
99
-
100
-
101
-
102
-
103
-
104
-
105
-
106
-
107
-
108
-
109
-
110
-
111
-
112
-
113
-
114
-
115
-
116
-
117
-
118
-
119
-
120
-
121
-
122
-
123
-
124
-
125
-
126
-
127
-
128
-
129
-
130
-
131
-
132
-
133
-
134
-
135
-
136
-
137
-
138
-
139
-
140
-
141
-
142
-
143
-
144
-
145
-
146
-
147
-
148
-
149
-
150
-
151
-
152
-
153
-
154
-
155
-
156
-
157
-
158
-
159
-
160
-
161
-
162
-
163
-
164
-
165
-
166
-
167
-
168
-
169
-
170
-
171
-
172
-
173
-
174
-
175
 |
 |

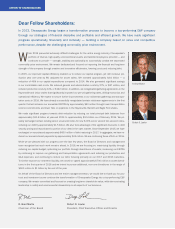
While 2015 presented extremely difcult challenges for the entire energy industry, Chesapeake’s
portfolio of diverse, high-quality unconventional assets and talented employees provided — and
continues to provide — strength, stability and optionality to successfully combat the depressed
commodity price environment. We remain dedicated and focused on improving the nancial and long-term
strength of the company through creative and innovative efciencies, lowering costs and reducing debt.
In 2015, our improved capital efciency enabled us to reduce our capital program, yet still increase pro-
duction year over year by 8% (adjusted for asset sales). We invested approximately $3.6 billion — a
reduction of 46% in our capital expenditures compared to 2014. We also generated signicant savings
in our controllable cash costs. We reduced general and administrative costs by 27%, or $87 million, and
reduced production costs by 13%, or $162 million. In addition, we renegotiated gathering agreements in the
Haynesville and Utica shales that signicantly improved our per-unit gathering rates, drilling economics and
operational efciency. We expect to secure further improvements in our midstream gathering and transpor-
tation costs in 2016. We have already successfully renegotiated certain midstream agreements in the rst
quarter that will enhance our annualized EBITDA by approximately $50 million through lower transportation
volume commitments and lower fees on pipelines in the Haynesville, Barnett and Eagle Ford shales.
We made signicant progress towards debt reduction by reducing our total principal debt balances from
approximately $11.8 billion at year-end 2014 to approximately $9.5 billion as of February 2016. We pri-
vately exchanged certain existing senior unsecured notes for new 8.00% senior second lien secured notes,
reducing our debt by approximately $1.5 billion. We also took advantage of the signicant discounts in debt
security pricing and repurchased a portion of our debt in the open market. Since September 2015, we have
exchanged or repurchased approximately $600 million of debt maturing in 2017. In aggregate, we have re-
duced our annual interest payments by approximately $34 million. We are continuing these efforts in 2016.
While we are pleased with our progress over the last few years, the Board of Directors and management
team recognize that much work remains ahead. In 2016, we are focusing on: maximizing liquidity through
reducing our capital budget; optimizing our portfolio through divestitures of assets; increasing our EBITDA
by continuing to improve our gathering and transportation agreements and reducing our production and
G&A expenses; and continuing to reduce our debt, focusing primarily on our 2017 and 2018 maturities.
To further improve our near-term liquidity, we closed or signed approximately $700 million in asset divesti-
tures in the rst quarter of 2016 and we intend to pursue additional, non-core divestitures in the range of
$500 million to $1 billion by the end of the year.
On behalf of the Board of Directors and the entire management team, we would like to thank you for your
trust and investment as we continue the transformation of Chesapeake Energy into a top-performing E&P
company. We remain committed and focused on creating long-term shareholder value, while demonstrating
leadership in safety and environmental stewardship in all aspects of our business.
In 2013, Chesapeake Energy began a transformation process to become a top-performing E&P company
through our strategies of nancial discipline and protable and efcient growth. We have made signicant
progress operationally, nancially and culturally — building a company based on value and competitive
performance, despite the challenging commodity price environment.
LETTER TO SHAREHOLDERS
Dear Fellow Shareholders:
Robert D. Lawler
R. Brad Martin
R. Brad Martin
Chairman of the Board
Robert D. Lawler
President, Chief Executive Ofcer and Director