Chesapeake Energy 2015 Annual Report Download - page 12
Download and view the complete annual report
Please find page 12 of the 2015 Chesapeake Energy annual report below. You can navigate through the pages in the report by either clicking on the pages listed below, or by using the keyword search tool below to find specific information within the annual report.-
 1
1 -
 2
2 -
 3
3 -
 4
4 -
 5
5 -
 6
6 -
 7
7 -
 8
8 -
 9
9 -
 10
10 -
 11
11 -
 12
12 -
 13
13 -
 14
14 -
 15
15 -
 16
16 -
 17
17 -
 18
18 -
 19
19 -
 20
20 -
 21
21 -
 22
22 -
23
-
24
-
25
-
26
-
27
-
28
-
29
-
30
-
31
-
32
-
33
-
34
-
35
-
36
-
37
-
38
-
39
-
40
-
41
-
42
-
43
-
44
-
45
-
46
-
47
-
48
-
49
-
50
-
51
-
52
-
53
-
54
-
55
-
56
-
57
-
58
-
59
-
60
-
61
-
62
-
63
-
64
-
65
-
66
-
67
-
68
-
69
-
70
-
71
-
72
-
73
-
74
-
75
-
76
-
77
-
78
-
79
-
80
-
81
-
82
-
83
-
84
-
85
-
86
-
87
-
88
-
89
-
90
-
91
-
92
-
93
-
94
-
95
-
96
-
97
-
98
-
99
-
100
-
101
-
102
-
103
-
104
-
105
-
106
-
107
-
108
-
109
-
110
-
111
-
112
-
113
-
114
-
115
-
116
-
117
-
118
-
119
-
120
-
121
-
122
-
123
-
124
-
125
-
126
-
127
-
128
-
129
-
130
-
131
-
132
-
133
-
134
-
135
-
136
-
137
-
138
-
139
-
140
-
141
-
142
-
143
-
144
-
145
-
146
-
147
-
148
-
149
-
150
-
151
-
152
-
153
-
154
-
155
-
156
-
157
-
158
-
159
-
160
-
161
-
162
-
163
-
164
-
165
-
166
-
167
-
168
-
169
-
170
-
171
-
172
-
173
-
174
-
175
 |
 |

8
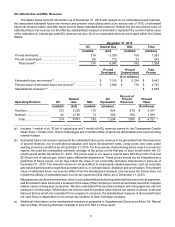
We engaged two third-party engineering firms to prepare approximately 59% by volume and 77% by value of our
estimated proved reserves at year-end 2015. The portion of our estimated proved reserves prepared by each of our
third-party engineering firms as of December 31, 2015 is presented below.
% Prepared
(by Volume) % Prepared
(by Value) Operating Division
Ryder Scott Company, L.P............................................... 36% 58% Southern
PetroTechnical Services, Division of
Schlumberger Technology Corporation ........................ 23% 19% Northern
Copies of the reports issued by the engineering firms are filed with this report as Exhibits 99.1 and 99.2. The
qualifications of the technical person at each of these firms primarily responsible for overseeing his firm's preparation
of the Company's reserve estimates are set forth below.
Ryder Scott Company, L.P.
• over 30 years of practical experience in the estimation and evaluation of reserves
• registered professional engineer in the state of Texas
• member in good standing of the Society of Petroleum Engineers and the Society of Petroleum Evaluation
Engineers
• Bachelor of Science degree in Electrical Engineering
PetroTechnical Services, Division of Schlumberger Technology Corporation
• over 30 years of practical experience in the estimation and evaluation of reserves
• registered professional geologist license in the Commonwealth of Pennsylvania
• member in good standing of the Society of Petroleum Engineers and the Society of Petroleum Evaluation
Engineers
• Bachelor of Science degree in Geological Sciences
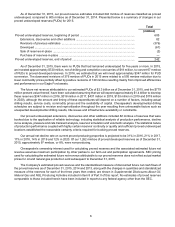
Costs Incurred in Oil and Natural Gas Property Acquisition, Exploration and Development
The following table sets forth historical costs incurred in oil and natural gas property acquisitions, exploration and
development activities during the periods indicated:
Years Ended December 31,
2015 2014 2013
($ in millions)
Acquisition of Properties:
Proved properties ................................................................................... $ — $ 214 $ 22
Unproved properties ............................................................................... 454 1,224 997
Exploratory costs ...................................................................................... 112 421 699
Development costs ................................................................................... 2,941 4,204 4,888
Costs incurred(a)(b) .............................................................................. $ 3,507 $ 6,063 $ 6,606
___________________________________________
(a) Exploratory and development costs are net of joint venture drilling and completion cost carries of $51 million,
$679 million and $884 million in 2015, 2014 and 2013, respectively.
(b) Includes capitalized interest and asset retirement obligations as follows:
Capitalized interest ........................................................................... $ 410 $ 604 $ 815
Asset retirement obligations ............................................................. $ (15) $ 39 $ 7