Chesapeake Energy 2012 Annual Report Download - page 2
Download and view the complete annual report
Please find page 2 of the 2012 Chesapeake Energy annual report below. You can navigate through the pages in the report by either clicking on the pages listed below, or by using the keyword search tool below to find specific information within the annual report.-
 1
1 -
 2
2 -
 3
3 -
 4
4 -
 5
5 -
 6
6 -
 7
7 -
 8
8 -
 9
9 -
 10
10 -
 11
11 -
 12
12 -
 13
13 -
14
-
15
-
16
-
17
-
18
-
19
-
20
-
21
-
22
-
23
-
24
-
25
-
26
-
27
-
28
-
29
-
30
-
31
-
32
-
33
-
34
-
35
-
36
-
37
-
38
-
39
-
40
-
41
-
42
-
43
-
44
-
45
-
46
-
47
-
48
-
49
-
50
-
51
-
52
-
53
-
54
-
55
-
56
-
57
-
58
-
59
-
60
-
61
-
62
-
63
-
64
-
65
-
66
-
67
-
68
-
69
-
70
-
71
-
72
-
73
-
74
-
75
-
76
-
77
-
78
-
79
-
80
-
81
-
82
-
83
-
84
-
85
-
86
-
87
-
88
-
89
-
90
-
91
-
92
-
93
-
94
-
95
-
96
-
97
-
98
-
99
-
100
-
101
-
102
-
103
-
104
-
105
-
106
-
107
-
108
-
109
-
110
-
111
-
112
-
113
-
114
-
115
-
116
-
117
-
118
-
119
-
120
-
121
-
122
-
123
-
124
-
125
-
126
-
127
-
128
-
129
-
130
-
131
-
132
-
133
-
134
-
135
-
136
-
137
-
138
-
139
-
140
-
141
-
142
-
143
-
144
-
145
-
146
-
147
-
148
-
149
-
150
-
151
-
152
-
153
-
154
-
155
-
156
-
157
-
158
-
159
-
160
-
161
-
162
-
163
-
164
-
165
-
166
-
167
-
168
-
169
-
170
-
171
-
172
-
173
-
174
-
175
-
176
-
177
-
178
-
179
-
180
-
181
-
182
-
183
-
184
-
185
-
186
-
187
-
188
-
189
-
190
-
191
-
192
-
193
-
194
-
195
-
196
 |
 |

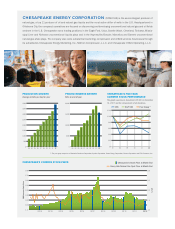
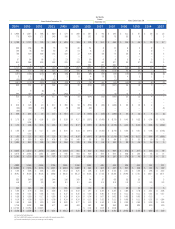
(1) The peer group comprises of Anadarko Petroleum Corporation, Apache Corporation, Devon Energy Corporation, Encana Corporation and EOG Resources, Inc.
CHESAPEAKE’S COMMON STOCK PRICE
Chesapeake’s Stock Price at Month End
Henry Hub Natural Gas Spot Price at Month End
CHESAPEAKE ENERGY CORPORATION (NYSE:CHK) is the second-largest producer of
natural gas, a top 11 producer of oil and natural gas liquids and the most active driller of wells in the U.S. Headquartered in
Oklahoma City, the company’s operations are focused on discovering and developing unconventional natural gas and oil elds
onshore in the U.S. Chesapeake owns leading positions in the Eagle Ford, Utica, Granite Wash, Cleveland, Tonkawa, Missis-
sippi Lime and Niobrara unconventional liquids plays and in the Haynesville/Bossier, Marcellus and Barnett unconventional
natural gas shale plays. The company also owns substantial marketing, compression and oileld services businesses through
its subsidiaries Chesapeake Energy Marketing, Inc., MidCon Compression, L.L.C. and Chesapeake Oileld Operating, L.L.C.
PRODUCTION GROWTH
Average mmcfe per day for year
0
500
1,000
1,500
2,000
2,500
3,000
3,500
4,000
0807 09 10 11 1206050403
PROVED RESERVE GROWTH
Bcfe at end of year
1009080706050403 11 12
0
5,000
10,000
15,000
20,000
CHK Common Stock Price
$/mcf
DEC 02 DEC 03 DEC 04 DEC 05 DEC 06 DEC 07 DEC 08 DEC 09 DEC 10 DEC 11 DEC 12
$ 0
$ 10
$ 20
$ 30
$ 40
$ 50
$ 60
$ 70
$ 80
$ 0
$ 5
$ 10
$ 15
$ 20
07 08 09 10 11 12
$ 0
$ 60
$ 40
$ 20
$ 80
$ 100
$ 120
CHESAPEAKE’S FIVE-YEAR
COMMON STOCK PERFORMANCE
The graph assumes an investment of $100 on December
31, 2007 and the reinvestment of all dividends.
CHK S&P 500 Peer Group(1)