Chesapeake Energy 2012 Annual Report Download - page 11
Download and view the complete annual report
Please find page 11 of the 2012 Chesapeake Energy annual report below. You can navigate through the pages in the report by either clicking on the pages listed below, or by using the keyword search tool below to find specific information within the annual report.-
 1
1 -
 2
2 -
 3
3 -
 4
4 -
 5
5 -
 6
6 -
 7
7 -
 8
8 -
 9
9 -
 10
10 -
 11
11 -
 12
12 -
 13
13 -
 14
14 -
 15
15 -
 16
16 -
 17
17 -
 18
18 -
 19
19 -
 20
20 -
 21
21 -
 22
22 -
23
-
24
-
25
-
26
-
27
-
28
-
29
-
30
-
31
-
32
-
33
-
34
-
35
-
36
-
37
-
38
-
39
-
40
-
41
-
42
-
43
-
44
-
45
-
46
-
47
-
48
-
49
-
50
-
51
-
52
-
53
-
54
-
55
-
56
-
57
-
58
-
59
-
60
-
61
-
62
-
63
-
64
-
65
-
66
-
67
-
68
-
69
-
70
-
71
-
72
-
73
-
74
-
75
-
76
-
77
-
78
-
79
-
80
-
81
-
82
-
83
-
84
-
85
-
86
-
87
-
88
-
89
-
90
-
91
-
92
-
93
-
94
-
95
-
96
-
97
-
98
-
99
-
100
-
101
-
102
-
103
-
104
-
105
-
106
-
107
-
108
-
109
-
110
-
111
-
112
-
113
-
114
-
115
-
116
-
117
-
118
-
119
-
120
-
121
-
122
-
123
-
124
-
125
-
126
-
127
-
128
-
129
-
130
-
131
-
132
-
133
-
134
-
135
-
136
-
137
-
138
-
139
-
140
-
141
-
142
-
143
-
144
-
145
-
146
-
147
-
148
-
149
-
150
-
151
-
152
-
153
-
154
-
155
-
156
-
157
-
158
-
159
-
160
-
161
-
162
-
163
-
164
-
165
-
166
-
167
-
168
-
169
-
170
-
171
-
172
-
173
-
174
-
175
-
176
-
177
-
178
-
179
-
180
-
181
-
182
-
183
-
184
-
185
-
186
-
187
-
188
-
189
-
190
-
191
-
192
-
193
-
194
-
195
-
196
 |
 |

1
Part I
ITEM 1. Business
Our Business
We are the second-largest producer of natural gas, a top 11 producer of liquids and the most active driller of wells
in the U.S. We own interests in approximately 45,400 producing natural gas and oil wells that are currently producing
approximately 3.9 bcfe per day, net to our interest. The Company has built a large resource base of onshore U.S.
unconventional natural gas and liquids assets. Our core natural gas resource plays are the Haynesville/Bossier Shales
in northwestern Louisiana and East Texas; the Marcellus Shale in the northern Appalachian Basin of West Virginia and
Pennsylvania; and the Barnett Shale in the Fort Worth Basin of north-central Texas. In addition, we have built leading
positions in the liquids-rich resource plays of the Eagle Ford Shale in South Texas; the Utica Shale in Ohio and
Pennsylvania; the Granite Wash, Cleveland, Tonkawa and Mississippi Lime plays in the Anadarko Basin in northwestern
Oklahoma, the Texas Panhandle and southern Kansas; and the Niobrara Shale in the Powder River Basin in Wyoming.
We have also vertically integrated many of our operations and own substantial marketing, compression and oilfield
services businesses.
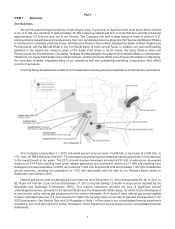
The map below illustrates the locations of Chesapeake's natural gas and oil exploration and production operations.
The Company's December 31, 2012 estimated proved reserves were 15.690 tcfe, a decrease of 3.099 tcfe, or
17%, from 18.789 tcfe at year-end 2011. The decrease was primarily price related as natural gas prices in 2012 declined
to the lowest levels in ten years. The 2012 proved reserve movement included 6.391 tcfe of extensions, downward
revisions of 5.414 tcfe resulting from lower natural gas prices and downward revisions of 1.349 tcfe resulting from
changes to previous estimates. In 2012, we produced 1.422 tcfe, acquired 42 bcfe and divested 1.347 tcfe of estimated
proved reserves, including the disposition of 1.013 tcfe associated with the sale of our Permian Basin assets in
September and October 2012.
Natural gas prices used in estimating proved reserves as of December 31, 2012 decreased by $1.36, or 33%, to
$2.76 per mcf from $4.12 per mcf as of December 31, 2011 using the trailing 12-month average prices required by the
Securities and Exchange Commission (SEC). The reserve reductions included the loss of significant proved
undeveloped reserves, primarily in the Barnett Shale and the Haynesville Shale plays, for which future development
is uneconomic at the natural gas prices used in the reserve estimates. As a result of lower natural gas prices leading
to lower estimated reserves, we were required to impair the carrying value of our natural gas and oil properties in the
2012 third quarter. See Natural Gas and Oil Properties in Note 1 of the notes to our consolidated financial statements
included in Item 8 of this report for further discussion of this impairment and its impact on the consolidated financial
statements.