Chesapeake Energy 2012 Annual Report Download - page 17
Download and view the complete annual report
Please find page 17 of the 2012 Chesapeake Energy annual report below. You can navigate through the pages in the report by either clicking on the pages listed below, or by using the keyword search tool below to find specific information within the annual report.-
 1
1 -
2
-
3
-
4
-
5
-
6
-
 7
7 -
 8
8 -
 9
9 -
 10
10 -
 11
11 -
 12
12 -
 13
13 -
 14
14 -
 15
15 -
 16
16 -
 17
17 -
 18
18 -
 19
19 -
 20
20 -
 21
21 -
 22
22 -
 23
23 -
 24
24 -
 25
25 -
 26
26 -
 27
27 -
28
-
29
-
30
-
31
-
32
-
33
-
34
-
35
-
36
-
37
-
38
-
39
-
40
-
41
-
42
-
43
-
44
-
45
-
46
-
47
-
48
-
49
-
50
-
51
-
52
-
53
-
54
-
55
-
56
-
57
-
58
-
59
-
60
-
61
-
62
-
63
-
64
-
65
-
66
-
67
-
68
-
69
-
70
-
71
-
72
-
73
-
74
-
75
-
76
-
77
-
78
-
79
-
80
-
81
-
82
-
83
-
84
-
85
-
86
-
87
-
88
-
89
-
90
-
91
-
92
-
93
-
94
-
95
-
96
-
97
-
98
-
99
-
100
-
101
-
102
-
103
-
104
-
105
-
106
-
107
-
108
-
109
-
110
-
111
-
112
-
113
-
114
-
115
-
116
-
117
-
118
-
119
-
120
-
121
-
122
-
123
-
124
-
125
-
126
-
127
-
128
-
129
-
130
-
131
-
132
-
133
-
134
-
135
-
136
-
137
-
138
-
139
-
140
-
141
-
142
-
143
-
144
-
145
-
146
-
147
-
148
-
149
-
150
-
151
-
152
-
153
-
154
-
155
-
156
-
157
-
158
-
159
-
160
-
161
-
162
-
163
-
164
-
165
-
166
-
167
-
168
-
169
-
170
-
171
-
172
-
173
-
174
-
175
-
176
-
177
-
178
-
179
-
180
-
181
-
182
-
183
-
184
-
185
-
186
-
187
-
188
-
189
-
190
-
191
-
192
-
193
-
194
-
195
-
196
 |
 |

7
___________________________________________
(a) Natural gas equivalent is based on six mcf of natural gas to one barrel of oil or one barrel of NGL. This ratio
reflects an energy content equivalency and not a price or revenue equivalency. Given recent natural gas, oil and
NGL prices, the price for an mcfe of natural gas is significantly less than the price for an mcfe of oil or NGL.
(b) Includes revenue and operating costs and excludes depreciation and amortization of other assets. See
Depreciation and Amortization of Other Assets under Results of Operations in Item 7 of this report for details of
the depreciation and amortization of other assets associated with our marketing, gathering and compression and
oilfield services operating segments.
(c) Includes the effects of realized (gains) losses from interest rate derivatives, but excludes the effects of unrealized
(gains) losses and is net of amounts capitalized.
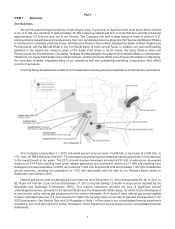
Natural Gas, Oil and NGL Reserves
The tables below set forth information as of December 31, 2012 with respect to our estimated proved reserves,
the associated estimated future net revenue and present value (discounted at an annual rate of 10%) of estimated
future net revenue before and after future income taxes (standardized measure) at such date. Neither the pre-tax
present value of estimated future net revenue nor the after-tax standardized measure is intended to represent the
current market value of the estimated natural gas, oil and NGL reserves we own. All of our estimated natural gas and
oil reserves are located within the U.S.
December 31, 2012
Natural Gas Oil NGL Total
(bcf) (mmbbl) (mmbbl) (bcfe)(a)
Proved developed ............................................... 7,174 162.9 132.1 8,944
Proved undeveloped ........................................... 3,759 332.6 165.2 6,746
Total proved(b) ....................................................... 10,933 495.5 297.3 15,690
Proved
Developed
Proved
Undeveloped
Total
Proved
($ in millions)
Estimated future net revenue(c) ........................................................... $ 20,510 $ 21,779 $ 42,289
Present value of estimated future net revenue(c) .............................. $ 10,793 $ 6,980 $ 17,773
Standardized measure(c)(d) ............................................................................................................................ $ 14,666
Operating Division
Natural
Gas Oil NGL
Natural
Gas
Equivalent
Percent of
Proved
Reserves
Present
Value
(bcf) (mmbbl) (mmbbl) (bcfe)(a) ($ millions)
Southern .......................... 3,532 11.7 23.4 3,742 24% $ 1,527
Northern........................... 2,680 153.5 130.8 4,385 28% 5,834
Eastern ............................ 3,891 9.5 34.3 4,155 26% 2,901
Western ........................... 830 320.8 108.8 3,408 22% 7,511
Total............................. 10,933 495.5 297.3 15,690 100% $ 17,773 (c)
___________________________________________
(a) Natural gas equivalent based on six mcf of natural gas to one barrel of oil or NGL.
(b) Includes 91 bcf of natural gas, 4 mmbbl of oil and 9 mmbbl of NGL reserves owned by the Chesapeake Granite
Wash Trust, 45 bcf of natural gas, 2 mmbbl of oil and 4 mmbbl of NGL of which are attributable to the noncontrolling
interest holders.
(c) Estimated future net revenue represents the estimated future gross revenue to be generated from the production
of proved reserves, net of estimated production and future development costs, using prices and costs under
existing economic conditions as of December 31, 2012. For the purpose of determining "prices", we used the
unweighted arithmetic average of the prices on the first day of each month within the 12-month period ended
December 31, 2012. The prices used in our reserve reports were $2.76 per mcf of natural gas and $94.84 per
barrel of oil, before price differential adjustments. Including the effect of price differential adjustments, the prices