Chesapeake Energy 2012 Annual Report Download - page 15
Download and view the complete annual report
Please find page 15 of the 2012 Chesapeake Energy annual report below. You can navigate through the pages in the report by either clicking on the pages listed below, or by using the keyword search tool below to find specific information within the annual report.-
 1
1 -
2
-
3
-
4
-
 5
5 -
 6
6 -
 7
7 -
 8
8 -
 9
9 -
 10
10 -
 11
11 -
 12
12 -
 13
13 -
 14
14 -
 15
15 -
 16
16 -
 17
17 -
 18
18 -
 19
19 -
 20
20 -
 21
21 -
 22
22 -
 23
23 -
 24
24 -
 25
25 -
26
-
27
-
28
-
29
-
30
-
31
-
32
-
33
-
34
-
35
-
36
-
37
-
38
-
39
-
40
-
41
-
42
-
43
-
44
-
45
-
46
-
47
-
48
-
49
-
50
-
51
-
52
-
53
-
54
-
55
-
56
-
57
-
58
-
59
-
60
-
61
-
62
-
63
-
64
-
65
-
66
-
67
-
68
-
69
-
70
-
71
-
72
-
73
-
74
-
75
-
76
-
77
-
78
-
79
-
80
-
81
-
82
-
83
-
84
-
85
-
86
-
87
-
88
-
89
-
90
-
91
-
92
-
93
-
94
-
95
-
96
-
97
-
98
-
99
-
100
-
101
-
102
-
103
-
104
-
105
-
106
-
107
-
108
-
109
-
110
-
111
-
112
-
113
-
114
-
115
-
116
-
117
-
118
-
119
-
120
-
121
-
122
-
123
-
124
-
125
-
126
-
127
-
128
-
129
-
130
-
131
-
132
-
133
-
134
-
135
-
136
-
137
-
138
-
139
-
140
-
141
-
142
-
143
-
144
-
145
-
146
-
147
-
148
-
149
-
150
-
151
-
152
-
153
-
154
-
155
-
156
-
157
-
158
-
159
-
160
-
161
-
162
-
163
-
164
-
165
-
166
-
167
-
168
-
169
-
170
-
171
-
172
-
173
-
174
-
175
-
176
-
177
-
178
-
179
-
180
-
181
-
182
-
183
-
184
-
185
-
186
-
187
-
188
-
189
-
190
-
191
-
192
-
193
-
194
-
195
-
196
 |
 |

5
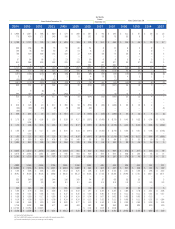
Drilling Activity
The following table sets forth the wells we drilled or participated in during the periods indicated. In the table, "gross"
refers to the total wells in which we had a working interest and "net" refers to gross wells multiplied by our working
interest.
2012 2011 2010
Gross % Net % Gross % Net % Gross % Net %
Development:
Productive ..... 2,075 99 956 99 2,536 99 1,077 99 2,721 99 1,031 99
Dry ................ 21 15
110 1 3 1 30 1 12 1
Total ............ 2,096 100 961 100 2,546 100 1,080 100 2,751 100 1,043 100
Exploratory:
Productive ..... 495 98 305 98 430 99 201 99 265 95 99 93
Dry ................ 10 26
23
11115577
Total ............ 505 100 311 100 433 100 202 100 280 100 106 100
The following table shows the wells we drilled or participated in by operating division:
2012 2011 2010
Gross
Wells
Net
Wells
Gross
Wells
Net
Wells
Gross
Wells
Net
Wells
Southern ........................................................ 363 183 1,104 550 1,023 495
Northern ......................................................... 942 441 1,076 342 1,371 369
Eastern .......................................................... 578 264 371 149 367 140
Western ......................................................... 718 384 428 241 270 145
Total........................................................... 2,601 1,272 2,979 1,282 3,031 1,149
At December 31, 2012, we had 1,033 (461 net) wells in drilling or completing status.