Chesapeake Energy 2012 Annual Report Download - page 14
Download and view the complete annual report
Please find page 14 of the 2012 Chesapeake Energy annual report below. You can navigate through the pages in the report by either clicking on the pages listed below, or by using the keyword search tool below to find specific information within the annual report.-
 1
1 -
2
-
3
-
 4
4 -
 5
5 -
 6
6 -
 7
7 -
 8
8 -
 9
9 -
 10
10 -
 11
11 -
 12
12 -
 13
13 -
 14
14 -
 15
15 -
 16
16 -
 17
17 -
 18
18 -
 19
19 -
 20
20 -
 21
21 -
 22
22 -
 23
23 -
 24
24 -
25
-
26
-
27
-
28
-
29
-
30
-
31
-
32
-
33
-
34
-
35
-
36
-
37
-
38
-
39
-
40
-
41
-
42
-
43
-
44
-
45
-
46
-
47
-
48
-
49
-
50
-
51
-
52
-
53
-
54
-
55
-
56
-
57
-
58
-
59
-
60
-
61
-
62
-
63
-
64
-
65
-
66
-
67
-
68
-
69
-
70
-
71
-
72
-
73
-
74
-
75
-
76
-
77
-
78
-
79
-
80
-
81
-
82
-
83
-
84
-
85
-
86
-
87
-
88
-
89
-
90
-
91
-
92
-
93
-
94
-
95
-
96
-
97
-
98
-
99
-
100
-
101
-
102
-
103
-
104
-
105
-
106
-
107
-
108
-
109
-
110
-
111
-
112
-
113
-
114
-
115
-
116
-
117
-
118
-
119
-
120
-
121
-
122
-
123
-
124
-
125
-
126
-
127
-
128
-
129
-
130
-
131
-
132
-
133
-
134
-
135
-
136
-
137
-
138
-
139
-
140
-
141
-
142
-
143
-
144
-
145
-
146
-
147
-
148
-
149
-
150
-
151
-
152
-
153
-
154
-
155
-
156
-
157
-
158
-
159
-
160
-
161
-
162
-
163
-
164
-
165
-
166
-
167
-
168
-
169
-
170
-
171
-
172
-
173
-
174
-
175
-
176
-
177
-
178
-
179
-
180
-
181
-
182
-
183
-
184
-
185
-
186
-
187
-
188
-
189
-
190
-
191
-
192
-
193
-
194
-
195
-
196
 |
 |
4
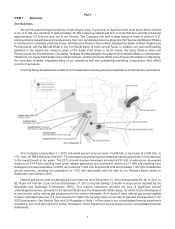
Operating Divisions
Chesapeake focuses its exploration, development, acquisition and production efforts in the four geographic
operating divisions described below.
Southern Division. Primarily includes the Haynesville/Bossier Shales in northwestern Louisiana and East Texas
and the Barnett Shale in the Fort Worth Basin of north-central Texas.
Northern Division. The Mid-Continent region, principally the Anadarko Basin in northwestern Oklahoma, the Texas
Panhandle and southern Kansas, including the Mississippi Lime, Cleveland and Tonkawa tight sands and Granite
Wash plays.
Eastern Division. Primarily includes the Marcellus Shale in the northern Appalachian Basin of West Virginia and
Pennsylvania and the Utica Shale in Ohio and Pennsylvania.
Western Division. Primarily includes the Eagle Ford Shale in South Texas, the Niobrara Shale in the Powder River
Basin in Wyoming and, prior to November 2012, the Permian and Delaware Basins of West Texas and southern New
Mexico. In September and October 2012, we sold all of our producing properties, gathering business and substantially
all of our leasehold in the Permian and Delaware Basins.
Well Data
At December 31, 2012, we had interests in approximately 45,400 gross (21,200 net) productive wells, including
properties in which we held an overriding royalty interest, of which 37,300 gross (18,500 net) were classified as primarily
natural gas productive wells and 8,100 gross (2,700 net) were classified as primarily oil productive wells. Chesapeake
operates approximately 27,200 of its 45,400 productive wells. During 2012, we drilled 1,642 gross (1,111 net) wells
and participated in another 959 gross (161 net) wells operated by other companies. We operate approximately 85%
of our current daily production volumes.