Cathay Pacific 2004 Annual Report Download - page 6
Download and view the complete annual report
Please find page 6 of the 2004 Cathay Pacific annual report below. You can navigate through the pages in the report by either clicking on the pages listed below, or by using the keyword search tool below to find specific information within the annual report.-
 1
1 -
 2
2 -
 3
3 -
 4
4 -
 5
5 -
 6
6 -
 7
7 -
 8
8 -
 9
9 -
 10
10 -
 11
11 -
 12
12 -
 13
13 -
 14
14 -
 15
15 -
 16
16 -
 17
17 -
18
-
19
-
20
-
21
-
22
-
23
-
24
-
25
-
26
-
27
-
28
-
29
-
30
-
31
-
32
-
33
-
34
-
35
-
36
-
37
-
38
-
39
-
40
-
41
-
42
-
43
-
44
-
45
-
46
-
47
-
48
-
49
-
50
-
51
-
52
-
53
-
54
-
55
-
56
-
57
-
58
-
59
-
60
-
61
-
62
-
63
-
64
-
65
-
66
-
67
-
68
-
69
-
70
-
71
-
72
-
73
-
74
-
75
-
76
-
77
 |
 |

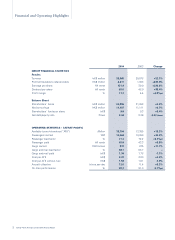
2004 2003 Change
GROUP FINANCIAL STATISTICS
Results
Turnover HK$ million 39,065 29,578 +32.1%
Profit attributable to shareholders HK$ million 4,417 1,303 +239.0%
Earnings per share HK cents 131.4 39.0 +236.9%
Dividend per share HK cents 65.0 48.0 +35.4%
Profit margin % 11.3 4.4 +6.9%pt
Balance Sheet
Shareholders’ funds HK$ million 32,855 31,052 +5.8%
Net borrowings HK$ million 11,187 11,111 +0.7%
Shareholders’ funds per share HK$ 9.8 9.3 +5.4%
Net debt/equity ratio Times 0.34 0.36 -0.02 times
OPERATING STATISTICS – CATHAY PACIFIC
Available tonne kilometres (“ATK”) Million 15,794 13,355 +18.3%
Passengers carried ‘000 13,664 10,059 +35.8%
Passenger load factor % 77.3 72.2 +5.1%pt
Passenger yield HK cents 45.8 43.3 +5.8%
Cargo carried ‘000 tonnes 972 875 +11.1%
Cargo and mail load factor % 68.7 68.7 –
Cargo and mail yield HK$ 1.76 1.78 -1.1%
Cost per ATK HK$ 2.07 2.00 +3.5%
Cost per ATK without fuel HK$ 1.58 1.61 -1.9%
Aircraft utilisation Hours per day 12.0 11.4 +5.3%
On-time performance % 90.3 91.0 -0.7%pt
Financial and Operating Highlights
2 Cathay Pacific Airways Limited 2004 Annual Report