Cathay Pacific 2004 Annual Report Download - page 19
Download and view the complete annual report
Please find page 19 of the 2004 Cathay Pacific annual report below. You can navigate through the pages in the report by either clicking on the pages listed below, or by using the keyword search tool below to find specific information within the annual report.-
 1
1 -
2
-
3
-
4
-
5
-
6
-
7
-
8
-
 9
9 -
 10
10 -
 11
11 -
 12
12 -
 13
13 -
 14
14 -
 15
15 -
 16
16 -
 17
17 -
 18
18 -
 19
19 -
 20
20 -
 21
21 -
 22
22 -
 23
23 -
 24
24 -
 25
25 -
 26
26 -
 27
27 -
 28
28 -
 29
29 -
30
-
31
-
32
-
33
-
34
-
35
-
36
-
37
-
38
-
39
-
40
-
41
-
42
-
43
-
44
-
45
-
46
-
47
-
48
-
49
-
50
-
51
-
52
-
53
-
54
-
55
-
56
-
57
-
58
-
59
-
60
-
61
-
62
-
63
-
64
-
65
-
66
-
67
-
68
-
69
-
70
-
71
-
72
-
73
-
74
-
75
-
76
-
77
 |
 |

Cathay Pacific Airways Limited 2004 Annual Report 15
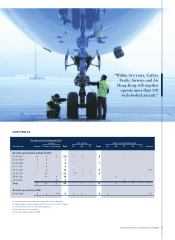
– Group turnover rose by 32.1% on 2003.
– Passenger turnover increased significantly by
41.5% to HK$26,407 million as a result of improved
demand. The number of passengers carried
increased by 35.8% to 13.7 million and revenue
passenger kilometres increased by 33.9%.
– Passenger load factor increased by 5.1 percentage
points to 77.3% while capacity, in terms of
available seat kilometres, increased by 24.9%.
– Passenger yield increased by 5.8% to HK¢45.8.
– First and business class revenues increased by
45.0% and the front end load factor increased
from 57.6% to 63.1%. Economy class revenue
increased by 39.9% and the economy class load
factor increased from 75.0% to 80.0%.
– Cathay Pacific’s cargo turnover increased by 12.0%
to HK$10,549 million. The improvement
represents the continued growth in exports from
Southern China to Europe, Japan and the United
States through Hong Kong.
– Cathay Pacific’s cargo load factor remained
at 68.7% while capacity increased by 13.4%.
Cargo yield decreased by 1.1% to HK$1.76.
– The improvement in Cathay Pacific’s turnover can
be analysed as follows:
– Revenue load factor increased by 3.7 percentage
points to 74.8% while the breakeven load factor
fell by 1.9 percentage points to 65.5%.
– The annualised revenue effect on changes
in yield and load factor is set out below:
HK$M
+24.9% Passenger capacity 4,624
+13.4% Cargo and mail capacity 1,261
+5.1%pt Passenger load factor 1,693
– Cargo and mail load factor –
+5.8% Passenger yield 1,427
-1.1% Cargo and mail yield (129 )
8,876
HK$M
+ 1 percentage point in 340
passenger load factor
+ 1 percentage point in cargo 154
and mail load factor
+ HK¢1 in passenger yield 573
+ HK¢1 in cargo and mail yield 60
REVENUE AND BREAKEVEN LOAD FACTOR