Cathay Pacific 2004 Annual Report Download - page 12
Download and view the complete annual report
Please find page 12 of the 2004 Cathay Pacific annual report below. You can navigate through the pages in the report by either clicking on the pages listed below, or by using the keyword search tool below to find specific information within the annual report.-
 1
1 -
 2
2 -
 3
3 -
 4
4 -
 5
5 -
 6
6 -
 7
7 -
 8
8 -
 9
9 -
 10
10 -
 11
11 -
 12
12 -
 13
13 -
 14
14 -
 15
15 -
 16
16 -
 17
17 -
 18
18 -
 19
19 -
 20
20 -
 21
21 -
 22
22 -
23
-
24
-
25
-
26
-
27
-
28
-
29
-
30
-
31
-
32
-
33
-
34
-
35
-
36
-
37
-
38
-
39
-
40
-
41
-
42
-
43
-
44
-
45
-
46
-
47
-
48
-
49
-
50
-
51
-
52
-
53
-
54
-
55
-
56
-
57
-
58
-
59
-
60
-
61
-
62
-
63
-
64
-
65
-
66
-
67
-
68
-
69
-
70
-
71
-
72
-
73
-
74
-
75
-
76
-
77
 |
 |

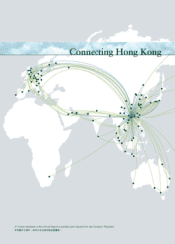
Review of Operations
New records were set for both passenger numbers and passenger revenue
as capacity increased 24.9% over 2003. Additional frequencies were added
to a number of routes, a non-stop service was launched to New York and
new codeshare services commenced to Barcelona, Madrid and Moscow.
Demand from both business and leisure travellers remained strong
throughout the year. The average load factor was 77.3%. Passenger yield
increased 5.8% to HK45.8 cents.
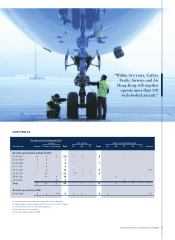
Passenger Services
LOAD FACTOR BY REGION PASSENGER LOAD FACTOR AND YIELD
AVAILABLE SEAT KILOMETRES (“ASK”), LOAD FACTOR AND YIELD BY REGION:
ASK (million) Load factor (%) Yield
2004 2003 Change 2004 2003 Change Change
North Asia 12,290 9,436 +30.2% 67.2 61.3 +5.9%pt -1.1%
South West Pacific and South Africa 12,466 10,109 +23.3% 72.2 72.6 -0.4%pt +9.1%
Europe 15,194 12,712 +19.5% 83.7 78.2 +5.5%pt +13.1%
South East Asia and Middle East 15,764 12,775 +23.4% 74.3 67.7 +6.6%pt -1.7%
North America 18,348 14,248 +28.8% 84.9 77.6 +7.3%pt +9.2%
Overall 74,062 59,280 +24.9% 77.3 72.2 +5.1%pt +5.8%
8 Cathay Pacific Airways Limited 2004 Annual Report