Barclays 2006 Annual Report Download - page 7
Download and view the complete annual report
Please find page 7 of the 2006 Barclays annual report below. You can navigate through the pages in the report by either clicking on the pages listed below, or by using the keyword search tool below to find specific information within the annual report.-
 1
1 -
 2
2 -
 3
3 -
 4
4 -
 5
5 -
 6
6 -
 7
7 -
 8
8 -
 9
9 -
 10
10 -
 11
11 -
 12
12 -
 13
13 -
 14
14 -
 15
15 -
 16
16 -
 17
17 -
 18
18 -
 19
19 -
 20
20 -
 21
21 -
 22
22 -
 23
23 -
 24
24 -
 25
25 -
 26
26 -
 27
27 -
 28
28 -
 29
29 -
 30
30 -
 31
31 -
 32
32 -
 33
33 -
 34
34 -
 35
35 -
 36
36 -
 37
37 -
 38
38 -
 39
39 -
 40
40 -
 41
41 -
 42
42 -
 43
43 -
 44
44 -
 45
45 -
 46
46 -
 47
47 -
 48
48 -
 49
49 -
 50
50 -
 51
51 -
 52
52 -
 53
53 -
 54
54 -
 55
55 -
 56
56 -
 57
57 -
 58
58 -
 59
59 -
 60
60 -
 61
61 -
 62
62 -
 63
63 -
 64
64 -
 65
65 -
 66
66 -
 67
67 -
 68
68 -
 69
69 -
 70
70 -
 71
71 -
 72
72 -
 73
73 -
 74
74 -
 75
75 -
 76
76 -
 77
77 -
 78
78 -
 79
79 -
 80
80 -
 81
81 -
 82
82 -
 83
83 -
 84
84 -
 85
85 -
 86
86 -
 87
87 -
 88
88 -
 89
89 -
 90
90 -
 91
91 -
 92
92 -
 93
93 -
 94
94 -
 95
95 -
 96
96 -
 97
97 -
 98
98 -
 99
99 -
 100
100 -
 101
101 -
 102
102 -
 103
103 -
 104
104 -
 105
105 -
 106
106 -
 107
107 -
 108
108 -
 109
109 -
 110
110 -
 111
111 -
 112
112 -
 113
113 -
 114
114 -
 115
115 -
 116
116 -
 117
117 -
 118
118 -
 119
119 -
 120
120 -
 121
121 -
 122
122 -
 123
123 -
 124
124 -
 125
125 -
 126
126 -
 127
127 -
 128
128 -
 129
129 -
 130
130 -
 131
131 -
 132
132 -
 133
133 -
 134
134 -
 135
135 -
 136
136 -
 137
137 -
 138
138 -
 139
139 -
 140
140 -
 141
141 -
 142
142 -
 143
143 -
 144
144 -
 145
145 -
 146
146 -
 147
147 -
 148
148 -
 149
149 -
 150
150 -
 151
151 -
 152
152 -
 153
153 -
 154
154 -
 155
155 -
 156
156 -
 157
157 -
 158
158 -
 159
159 -
 160
160 -
 161
161 -
 162
162 -
 163
163 -
 164
164 -
 165
165 -
 166
166 -
 167
167 -
 168
168 -
 169
169 -
 170
170 -
 171
171 -
 172
172 -
 173
173 -
 174
174 -
 175
175 -
 176
176 -
 177
177 -
 178
178 -
 179
179 -
 180
180 -
 181
181 -
 182
182 -
 183
183 -
 184
184 -
 185
185 -
 186
186 -
 187
187 -
 188
188 -
 189
189 -
 190
190 -
 191
191 -
 192
192 -
 193
193 -
 194
194 -
 195
195 -
 196
196 -
 197
197 -
 198
198 -
 199
199 -
 200
200 -
 201
201 -
 202
202 -
 203
203 -
 204
204 -
 205
205 -
 206
206 -
 207
207 -
 208
208 -
 209
209 -
 210
210 -
 211
211 -
 212
212 -
 213
213 -
 214
214 -
 215
215 -
 216
216 -
 217
217 -
 218
218 -
 219
219 -
 220
220 -
 221
221 -
 222
222 -
 223
223 -
 224
224 -
 225
225 -
 226
226 -
 227
227 -
 228
228 -
 229
229 -
 230
230 -
 231
231 -
 232
232 -
 233
233 -
 234
234 -
 235
235 -
 236
236 -
 237
237 -
 238
238 -
 239
239 -
 240
240 -
 241
241 -
 242
242 -
 243
243 -
 244
244 -
 245
245 -
 246
246 -
 247
247 -
 248
248 -
 249
249 -
 250
250 -
 251
251 -
 252
252 -
 253
253 -
 254
254 -
 255
255 -
 256
256 -
 257
257 -
 258
258 -
 259
259 -
 260
260 -
 261
261 -
 262
262 -
 263
263 -
 264
264 -
 265
265 -
 266
266 -
 267
267 -
 268
268 -
 269
269 -
 270
270 -
 271
271 -
 272
272 -
 273
273 -
 274
274 -
 275
275 -
 276
276 -
 277
277 -
 278
278 -
 279
279 -
 280
280 -
 281
281 -
 282
282 -
 283
283 -
 284
284 -
 285
285 -
 286
286 -
 287
287 -
 288
288 -
 289
289 -
 290
290 -
 291
291 -
 292
292 -
 293
293 -
 294
294 -
 295
295 -
 296
296 -
 297
297 -
 298
298 -
 299
299 -
 300
300 -
 301
301 -
 302
302 -
 303
303 -
 304
304 -
 305
305 -
 306
306 -
 307
307 -
 308
308 -
 309
309 -
 310
310
 |
 |

Barclays PLC
Annual Report 2006 3
Operating review
1
060504(a)
4,580
7,136
5,280
0
Profit before tax £m
8,000
7,000
6,000
5,000
3,000
4,000
2,000
1,000
060504(a)
51.0
71.9
54.4
0
Earnings per share pence
80
70
60
50
30
40
20
10
060504
24.0
26.6
0
Dividend per share pence
35
25
30
15
20
10
5
31.0
24.7%
Return on average
shareholders’ equity
7. 7 %
Tier 1 capital ratio
11. 7 %
Risk asset ratio
Note
(a) Does not reflect the application of IAS 32, IAS 39 and IFRS 4 which became effective from 1st January 2005.
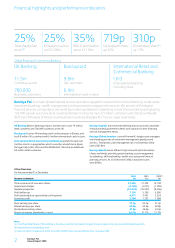
54%
Increase in economic profit
to £2,704m
Investment Banking and Investment Management
Barclays Wealth
£93bn
Total client assets
Barclays Capital Barclays
Global Investors
US$409bn
Value of debt issued globally
US$1,814bn
Assets under management
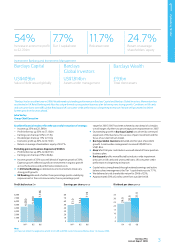
Excellent financial results reflect the successful execution of strategy:
– Income up 25% to £21,595m
– Profit before tax up 35% to £7,136m
– Earnings per share up 32% to 71.9p
– Dividend per share up 17% to 31.0p
– Economic profit up 54% to £2,704m
– Return on average shareholders’ equity of 24.7%.
Excluding gains on business disposals of £323m:
– Profit before tax up 29% to £6,813m
– Earnings per share up 23% to 66.8p.
•Income growth of 25% was well ahead of expense growth of 20%.
Expense growth reflected significant investment in organic growth
across the business and performance related costs.
•In UK Retail Banking accelerated income momentum drove very
strong profit growth.
•UK Banking delivered a further three percentage points underlying
improvement in the cost:income ratio; the six percentage point
target for 2005-2007 has been achieved a year ahead of schedule;
we still target a further two percentage point improvement in 2007.
•Outstanding growth in Barclays Capital was driven by continued
expansion of the business, the success of past investment and the
focus of our client driven model.
•Barclays Global Investors delivered another year of excellent
growth. Assets under management increased US$301bn to
US$1.8trn.
•Absa’s first full year contribution was well ahead of the acquisition
business plan.
•Barclaycard profits were affected by industry-wide impairment
pressures in UK cards and unsecured loans; UK consumer credit
performance is beginning to improve.
•Capital ratios strengthened through retained earnings and active
balance sheet management; the Tier 1 capital ratio rose to 7.7%.
•We delivered a total shareholder return for 2006 of 25%.
•Approximately 50% of profits came from outside the UK.
“Barclays had an excellent year in 2006. We delivered outstanding performance in Barclays Capital and Barclays Global Investors. Momentum has
accelerated in UK Retail Banking and Absa has outperformed our acquisition business plan delivering very strong growth. Conditions in UK cards
and consumer loans were difficult but Barclaycard UK consumer credit performance is beginning to improve. We are well positioned to deliver
further growth in the years ahead.”
John Varley
Group Chief Executive
