Barclays 2006 Annual Report Download - page 13
Download and view the complete annual report
Please find page 13 of the 2006 Barclays annual report below. You can navigate through the pages in the report by either clicking on the pages listed below, or by using the keyword search tool below to find specific information within the annual report.-
 1
1 -
2
-
 3
3 -
 4
4 -
 5
5 -
 6
6 -
 7
7 -
 8
8 -
 9
9 -
 10
10 -
 11
11 -
 12
12 -
 13
13 -
 14
14 -
 15
15 -
 16
16 -
 17
17 -
 18
18 -
 19
19 -
 20
20 -
 21
21 -
 22
22 -
 23
23 -
24
-
25
-
26
-
27
-
28
-
29
-
30
-
31
-
32
-
33
-
34
-
35
-
36
-
37
-
38
-
39
-
40
-
41
-
42
-
43
-
44
-
45
-
46
-
47
-
48
-
49
-
50
-
51
-
52
-
53
-
54
-
55
-
56
-
57
-
58
-
59
-
60
-
61
-
62
-
63
-
64
-
65
-
66
-
67
-
68
-
69
-
70
-
71
-
72
-
73
-
74
-
75
-
76
-
77
-
78
-
79
-
80
-
81
-
82
-
83
-
84
-
85
-
86
-
87
-
88
-
89
-
90
-
91
-
92
-
93
-
94
-
95
-
96
-
97
-
98
-
99
-
100
-
101
-
102
-
103
-
104
-
105
-
106
-
107
-
108
-
109
-
110
-
111
-
112
-
113
-
114
-
115
-
116
-
117
-
118
-
119
-
120
-
121
-
122
-
123
-
124
-
125
-
126
-
127
-
128
-
129
-
130
-
131
-
132
-
133
-
134
-
135
-
136
-
137
-
138
-
139
-
140
-
141
-
142
-
143
-
144
-
145
-
146
-
147
-
148
-
149
-
150
-
151
-
152
-
153
-
154
-
155
-
156
-
157
-
158
-
159
-
160
-
161
-
162
-
163
-
164
-
165
-
166
-
167
-
168
-
169
-
170
-
171
-
172
-
173
-
174
-
175
-
176
-
177
-
178
-
179
-
180
-
181
-
182
-
183
-
184
-
185
-
186
-
187
-
188
-
189
-
190
-
191
-
192
-
193
-
194
-
195
-
196
-
197
-
198
-
199
-
200
-
201
-
202
-
203
-
204
-
205
-
206
-
207
-
208
-
209
-
210
-
211
-
212
-
213
-
214
-
215
-
216
-
217
-
218
-
219
-
220
-
221
-
222
-
223
-
224
-
225
-
226
-
227
-
228
-
229
-
230
-
231
-
232
-
233
-
234
-
235
-
236
-
237
-
238
-
239
-
240
-
241
-
242
-
243
-
244
-
245
-
246
-
247
-
248
-
249
-
250
-
251
-
252
-
253
-
254
-
255
-
256
-
257
-
258
-
259
-
260
-
261
-
262
-
263
-
264
-
265
-
266
-
267
-
268
-
269
-
270
-
271
-
272
-
273
-
274
-
275
-
276
-
277
-
278
-
279
-
280
-
281
-
282
-
283
-
284
-
285
-
286
-
287
-
288
-
289
-
290
-
291
-
292
-
293
-
294
-
295
-
296
-
297
-
298
-
299
-
300
-
301
-
302
-
303
-
304
-
305
-
306
-
307
-
308
-
309
-
310
 |
 |

Barclays PLC
Annual Report 2006 9
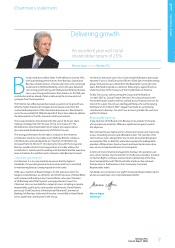
Operating review
1
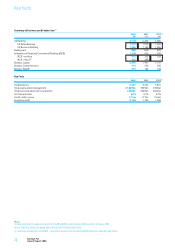
Group performance
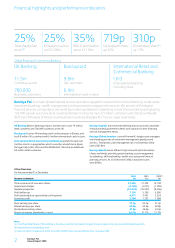
We made substantial progress on our strategic priorities and delivered
record financial results. Profit before tax increased 35% to £7,136m.
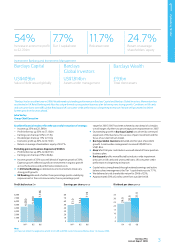
Earnings per share rose 32% to 71.9p, and economic profit was up 54%
to £2,704m. Profit excluding business disposals of £323m increased
29% to £6,813m, and earnings per share increased 23% to 66.8p.
We increased the total dividend payout to 31p, a rise of 17%.
Income grew 25% to £21,595m, well ahead of expense growth of 20%.
The growth was broadly based by business and geography, reflecting
momentum in each business. All businesses made significant
contributions, with especially strong performances from Barclays
Capital, UK Banking and Barclays Global Investors, and a substantial
contribution to income from Absa in its first full year of ownership.
Excluding Absa, Group income grew 18%, compared with expense
growth of 13%. The mix of income and profit continued to evolve.
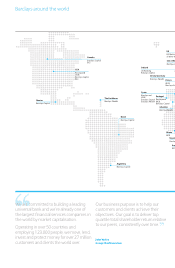
Approximately half our profits came from outside the UK, up from
about 30% in 2003.
Operating expenses increased 20% to £12,674m. The Group
cost:income ratio improved two percentage points to 59%.
We continue to target top quartile productivity for all businesses,
and in 2006 the ratio improved or remained flat in all businesses.
Operating expenses include gains on the sale of properties of £432m
partly offset by accelerated incremental investment expenditure of
approximately £280m.
Impairment charges rose 37% to £2,154m. Excluding Absa, impairment
charges on loans and advances increased 26%. The increase was
mostly attributable to the challenging credit environment in UK
unsecured retail lending, which was partly due to the continued rise in
the level of personal insolvencies. In the second half of 2006, as a result
of a number of management actions, flows into delinquency decreased
and arrears balances declined across the UK cards and unsecured loans
portfolios. We therefore believe that we passed the worst in Barclaycard
UK impairment in the second half of 2006. UK mortgage impairment
charges remained negligible, and the wholesale and larger corporate
sectors continued to be stable with a low level of defaults.
When I look at these results, I am pleased to see increased productivity
in our use of capital, risk and costs. Return on average shareholders’
funds improved four percentage points to 25%; profits grew much
faster than Daily Value at Risk and risk weighted assets and the
associated consumption of capital; and income growth exceeded cost
growth by five percentage points.
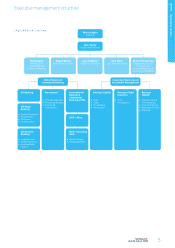
Capital management
Our strong credit rating and disciplined approach to capital
management remain sources of competitive advantage. Our capital
management policies are designed to optimise the returns to
shareholders whilst maintaining our credit rating.
At the end of 2006, our Tier 1 capital ratio was 7.7% (2005: 7.0%).
The improved capital ratio was driven by the strong capital generation
of our business portfolio, the impact of disposals, including our stake in
FirstCaribbean International Bank, and the efficient management of the
balance sheet through the use of the capital markets. We have invested
almost £2bn to support the capital required for our organic growth
throughout the portfolio at a very attractive rate of return and we also
increased the dividend to shareholders by 17%.
We commenced parallel running for Basel II at the end of 2006. Whilst
there are still areas in which the regulators have not yet defined the
requirements for detailed implementation, we continue to anticipate
a modest benefit to our capital ratios from Basel II. For 2007 we will
continue to report our capital ratios under Basel I.
Executive management
I want to acknowledge the significant contributions of two executive
directors who are leaving Barclays. David Roberts, previously Chief
Executive of International Retail and Commercial Banking, left Barclays
at the end of 2006 after 23 years of outstanding service. Naguib Kheraj
has been a generator of very significant value for the Group over the last
ten years in a number of different roles at Barclays, most recently as
Group Finance Director. He will be leaving us in 2007. I thank David and
Naguib warmly for their dedication to the success of Barclays and I wish
them well for the future. Our new Group Finance Director, Chris Lucas
joins us in April and brings a wealth of experience in financial services.
Outlook
We enter 2007 with strong income momentum in Barclays, driven
by high levels of customer activity and good risk control. The global
economic outlook continues to be positive and we are well positioned
to capture further growth in the years ahead.
John Varley
Group Chief Executive