Barclays 2004 Annual Report Download - page 12
Download and view the complete annual report
Please find page 12 of the 2004 Barclays annual report below. You can navigate through the pages in the report by either clicking on the pages listed below, or by using the keyword search tool below to find specific information within the annual report.-
 1
1 -
 2
2 -
 3
3 -
 4
4 -
 5
5 -
 6
6 -
 7
7 -
 8
8 -
 9
9 -
 10
10 -
 11
11 -
 12
12 -
 13
13 -
 14
14 -
 15
15 -
 16
16 -
 17
17 -
 18
18 -
 19
19 -
 20
20 -
 21
21 -
 22
22 -
23
-
24
-
25
-
26
-
27
-
28
-
29
-
30
-
31
-
32
-
33
-
34
-
35
-
36
-
37
-
38
-
39
-
40
-
41
-
42
-
43
-
44
-
45
-
46
-
47
-
48
-
49
-
50
-
51
-
52
-
53
-
54
-
55
-
56
-
57
-
58
-
59
-
60
-
61
-
62
-
63
-
64
-
65
-
66
-
67
-
68
-
69
-
70
-
71
-
72
-
73
-
74
-
75
-
76
-
77
-
78
-
79
-
80
-
81
-
82
-
83
-
84
-
85
-
86
-
87
-
88
-
89
-
90
-
91
-
92
-
93
-
94
-
95
-
96
-
97
-
98
-
99
-
100
-
101
-
102
-
103
-
104
-
105
-
106
-
107
-
108
-
109
-
110
-
111
-
112
-
113
-
114
-
115
-
116
-
117
-
118
-
119
-
120
-
121
-
122
-
123
-
124
-
125
-
126
-
127
-
128
-
129
-
130
-
131
-
132
-
133
-
134
-
135
-
136
-
137
-
138
-
139
-
140
-
141
-
142
-
143
-
144
-
145
-
146
-
147
-
148
-
149
-
150
-
151
-
152
-
153
-
154
-
155
-
156
-
157
-
158
-
159
-
160
-
161
-
162
-
163
-
164
-
165
-
166
-
167
-
168
-
169
-
170
-
171
-
172
-
173
-
174
-
175
-
176
-
177
-
178
-
179
-
180
-
181
-
182
-
183
-
184
-
185
-
186
-
187
-
188
-
189
-
190
-
191
-
192
-
193
-
194
-
195
-
196
-
197
-
198
-
199
-
200
-
201
-
202
-
203
-
204
-
205
-
206
-
207
-
208
-
209
-
210
-
211
-
212
-
213
-
214
-
215
-
216
-
217
-
218
-
219
-
220
-
221
-
222
-
223
-
224
-
225
-
226
-
227
-
228
-
229
-
230
-
231
-
232
-
233
-
234
-
235
-
236
-
237
-
238
-
239
-
240
-
241
-
242
-
243
-
244
-
245
-
246
-
247
-
248
-
249
-
250
-
251
-
252
-
253
-
254
-
255
-
256
 |
 |

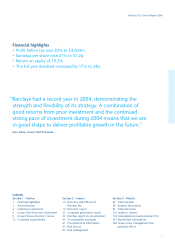
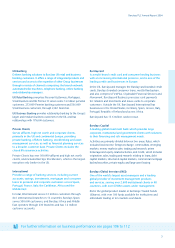
Profit before tax in Private Clients and International was up 60%.
The improved performance in this division reflected the benefits of
prior year investments – both organic and by acquisition – helped by
stronger markets. This included a significantly improved performance
from the closed life assurance activities.
Profit before tax in Private Clients, for the ongoing business, increased
42% benefiting from strong income growth and good cost control.
The integrations of Charles Schwab Europe and the Gerrard business
progressed well. In International, profit before tax increased by 14%.
This represented good progress across all geographies: Africa; Spain;
Portugal; France; Italy; and the Caribbean. The merging of Banco
Zaragozano with Barclays Spain to create one Spanish business is well
ahead of schedule and there has been a very good response amongst
the Banco Zaragozano network to Barclays products.
Barclaycard delivered profit before tax growth of 5% in a year where
volume growth more than compensated for the impact of successive
interest rate rises and intense competition. Income growth was 6%.
There was a high level of investment in both the UK business and
internationally, managed within cost growth of 6%. Performance was
strong in our multi-branded business such as Monument and FirstPlus.
Barclaycard International delivered a profit of £8m (2003: £4m) despite
absorbing significant ongoing investment. The acquisition of Juniper
was an important strategic move into the US credit card market.
Barclays Capital had another record year, with profit before tax up
25%. Income grew by 24%, reflecting the return on investment in prior
years. Client activity was up sharply, leading to good volume growth in
both primary and secondary markets. A significant level of investment
for future revenue growth was funded by the business and reflected in
costs which grew 37%. Approximately 50% of the cost base is variable
and despite the significant growth in staff numbers, income per head
remained broadly flat.
Barclays Global Investors (BGI) had another excellent year with profit
before tax up 85%. Profits have more than quadrupled during the last
three years. Income grew 33% and assets under management were
£709bn (2003: £598bn). BGI continued to diversify its product range
and in particular made significant advances in exchange traded funds
(iShares) where it is the market leader.
Capital Strength
Our capital position and strong credit rating are sources of
competitive advantage. At the end of 2004, our risk asset ratio was
11.5%, and our tier 1 capital ratio was 7.6%. This strong capital
1010
2002 2003 2004pence
60
50
40
30
20
10
0
Earnings per share
33.7
42.3
51.2
2002 2003 2004%
25
20
15
10
5
0
Post tax return on average
shareholders’ funds
14.7 17.0 19.2
2002 2003 2004£m
4,000
0
1,000
2,000
3,000
Profit before tax
3,205
3,845
4,603
5,000
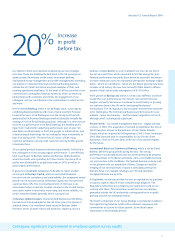
Return on average shareholders’ funds 19%
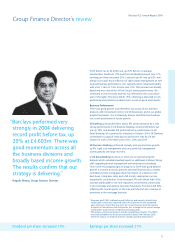
Group Finance Director’s review