Barclays 2004 Annual Report Download - page 11
Download and view the complete annual report
Please find page 11 of the 2004 Barclays annual report below. You can navigate through the pages in the report by either clicking on the pages listed below, or by using the keyword search tool below to find specific information within the annual report.
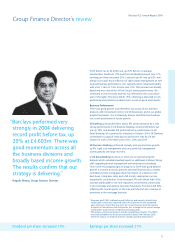
Profit before tax at £4,603m was up 20%. Return on average
shareholders’ funds was 19% and the total dividend payout rose 17%.
Earnings per share increased 21%. Economic profit1was up 32%, well
ahead of our goal and a reflection of tight capital management as well
as good business performance. Our capital position remained healthy,
with a tier 1 ratio of 7.6%. Income rose 12%. This increase was broadly
based and was a key driver of the Group’s strong performance. We
continued to invest heavily and this was reflected in the costs which
were 15% higher. Provisions fell by 19%, reflecting a sharp fall in non-
performing and potential problem loans as well as good asset quality.
Business Performance2
There was good growth in profit before tax across all our business
divisions with momentum in the core UK businesses and in our global
product businesses. Our increasingly diverse and distinctive business
mix is well positioned for future growth.
UK Banking grew profit before tax by 9%, driven primarily by a very
strong performance in UK Business Banking, where profit before tax
was up 19%, and broadly flat profit before tax performance in UK
Retail Banking. At a seminar for investors in October 2004, UK Banking
committed to a goal of reducing its cost:income ratio by 2% per
annum for each of the three years 2005, 2006 and 2007.
UK Business Banking performed strongly with good income growth,
up 8%, tight cost management and very good risk management
accentuated by one large recovery.
In UK Retail Banking the focus in 2004 was on restructuring the
business which included investing heavily in additional customer facing
staff, upgrading branch management and investing in technology.
There were encouraging signs of progress in 2004 with good balance
growth in current accounts, premier and small business but a weaker
contribution from mortgages where the impact of a decline in the
back book, rising base rates and a fall in early redemption income
impacted its contribution. Costs increased 3% with almost half of the
increase attributable to the new regulatory environment, particularly
in the mortgage and general insurance businesses. Provisions fell 44%,
reflecting the overall quality of the loan portfolio but also a release of
provisions in the mortgage business.
9
Barclays PLC Annual Report 2004
Dividend per share increased 17% Earnings per share increased 21%
Group Finance Director’s review
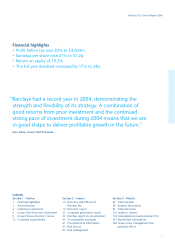
“Barclays performed very
strongly in 2004 delivering
record profit before tax, up
20% at £4,603m. There was
good momentum across all
the business divisions and
broadly based income growth.
The results confirm that our
strategy is delivering.”
Naguib Kheraj, Group Finance Director
1Economic profit (EP) is defined as profit after tax and minority interests plus
certain gains (and losses) reported within the statement of total recognised
gains and losses where they arise from the Group’s business activities and are
in respect of transactions with third parties, less a charge for the cost of average
shareholders’ funds (which includes purchased goodwill).
2The analysis of results by business includes goodwill amortisation. This differs
from that included in the results announcement dated 10th February 2005,
where the analysis of results by business excludes goodwill amortisation.

